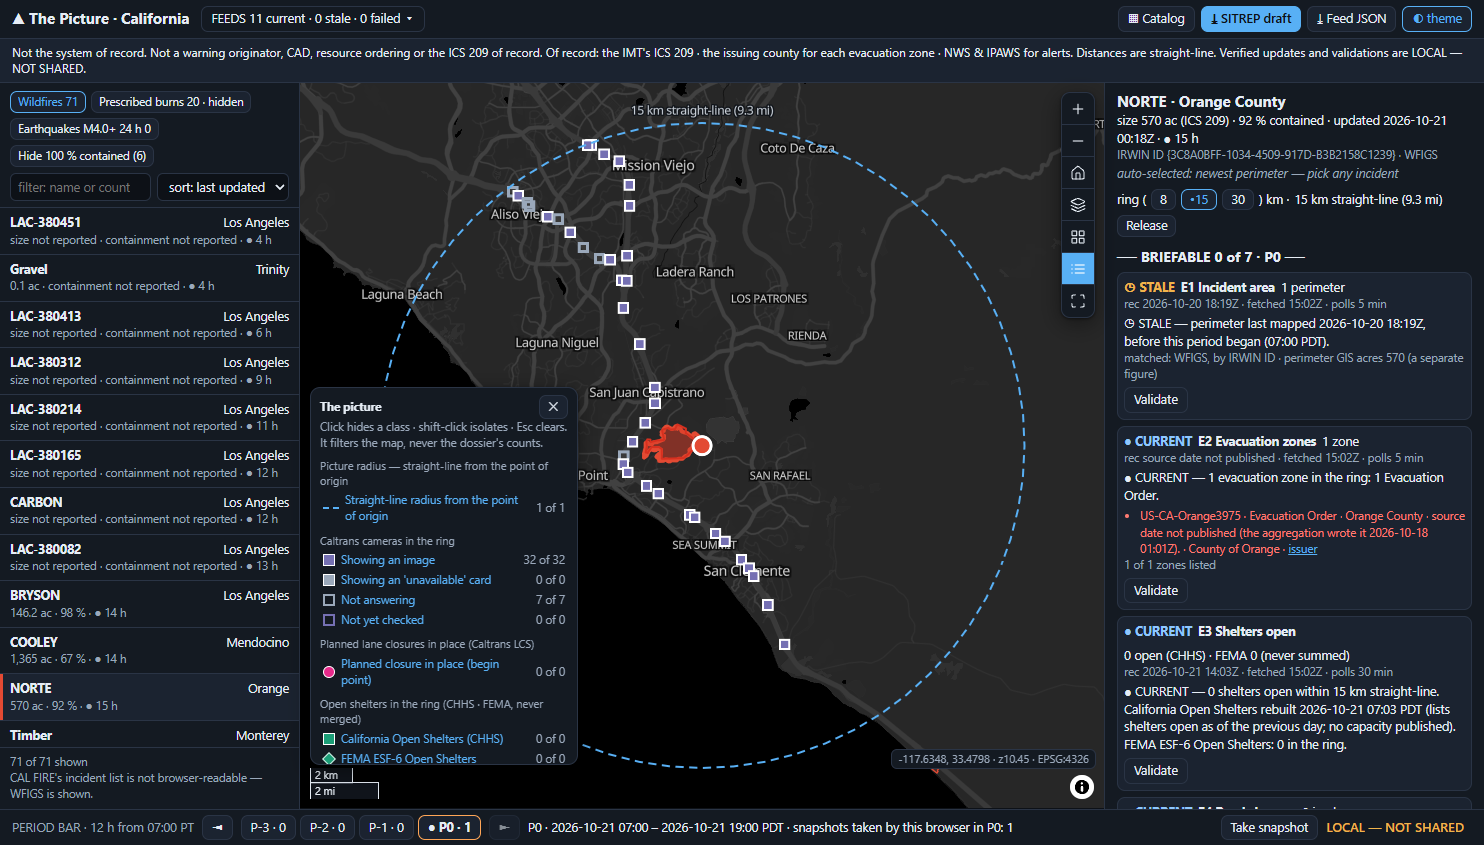
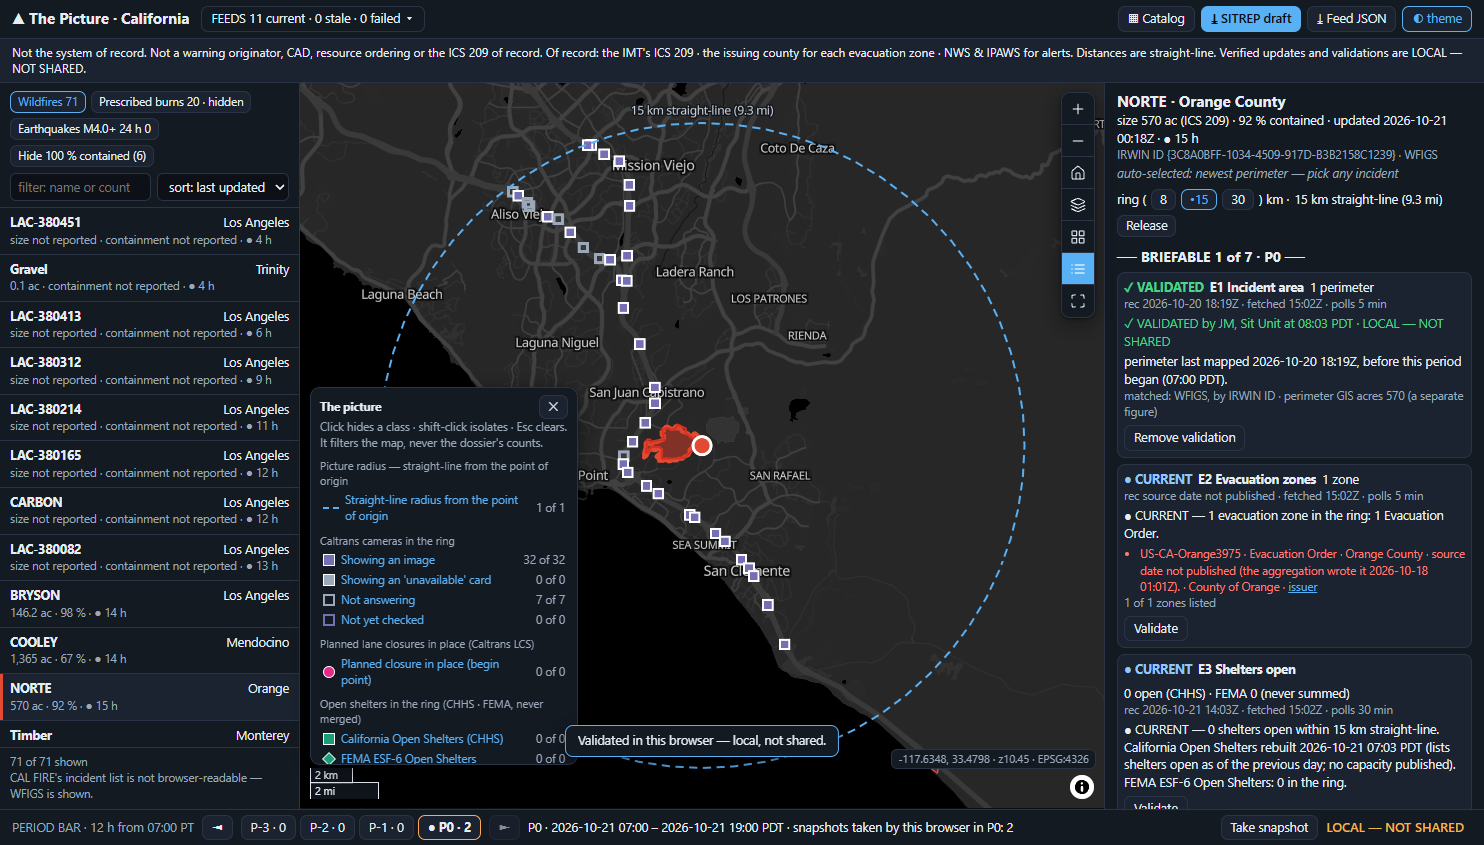
Pick an incident and the seven essential elements of information assemble round it, each with its time of record, its age against its own cadence and one of four states. One number heads them: BRIEFABLE n of 7 for this operational period.
The user is the EOC's Situational Awareness section, the Situation Unit elevated to report to the EOC director in NIMS's EOC structure. They assemble the picture for one incident, once per operational period. Their output is a briefing draft and a list of items still to validate.
It is never a decision to evacuate, dispatch or warn. Those belong to the incident commander, to CAD and to the alert originator. The app sits beside them, and anyone looking at the screen can see that.
All ten say "real-time" or "near-real-time". Only one (Esri) states a refresh interval and a last-update stamp. None shows which element of the picture is verified and which is not.
Juvare WebEOC · Veoci · D4H · Noggin · Hexagon OnCall · Esri · Everbridge VCC · Dataminr · Samdesk · AlertMedia, each read on its own product page.
We read the NIMS doctrine, Third Edition (October 2017) in full on 2026-10-21. "Common operating picture" appears in neither its glossary nor its body. The product category is named after a concept the standard never specifies, so the app cites what NIMS actually governs.
Staff "review data to determine if it is incomplete, inaccurate, embellished, outdated, or misleading" (p.56). Outdated is one of the five tests. That makes the age of every element a requirement of the doctrine.
A Situation Report is "confirmed or verified information" (p.70), "a snapshot of the incident status during the past operational period" (p.54). The period is "typically 12 to 24 hours" (p.68).
So the app's roles are NIMS's Essential Elements of Information, not every layer we could find. Each one carries its age, whether it has been validated, and the operational period it belongs to.
| What exists | How the picture is held | Freshness & verification | Verdict |
|---|---|---|---|
| Juvare WebEOC | boards; the Situation Report board rolls sections up for approval, "typically published at least once every 24 hours" | not stated per element | The system of record most EOC buyers own. We sit beside it |
| Esri Emergency Management Operations | an Incident Status Dashboard of maps, lists, charts and gauges | the only vendor page showing "last update" times and a 3-minute refresh | The stack the buyer may already own. This app runs on it |
| Veoci · D4H · Noggin · Hexagon OnCall | "create a common operating picture"; the map is one feature among boards | "real-time"; no per-element age or verification shown | Boards with a map: 6 of the 10 platforms read |
| Watch Duty · Perimeter | map-first. Watch Duty now sells "a common operating picture" to agencies; Perimeter replays incidents day by day | Watch Duty: "accuracy is more important than speed"; no data-age display stated | Sells trust to the public, but not per element or per period |
| The Picture | one incident · seven EEI · BRIEFABLE n of 7 | each element's age against its own cadence, whether it is validated, and the period it belongs to | The gap |
Across the field, freshness is a slogan, and verification is something the public products sell. No platform we read shows each element's age against its own cadence, marks which elements are verified, or ties either to the period whose SITREP they feed.
We considered three layouts. A board of tiles with a map widget was rejected: six of ten platforms already sell exactly that, and it turns the incident into a filter. A scrolling briefing page was rejected because the operator would read it instead of operating it. The incident anchor won, because the question starts with "for the incident I pick".
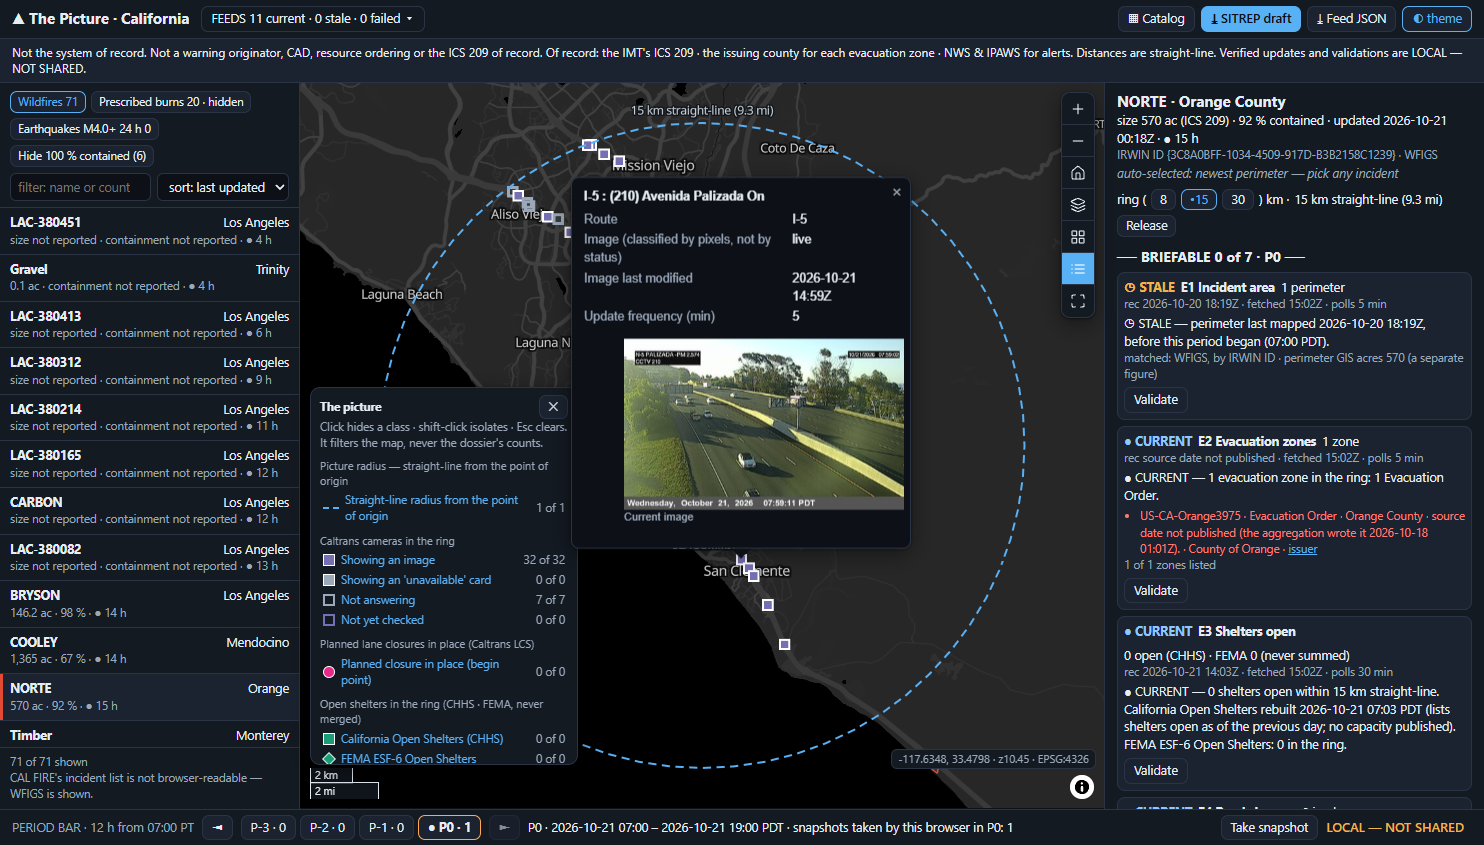
Pick a row and that incident lights up while the rest dim to 35 %. A dashed 15 km straight-line ring is drawn round its point of origin, and the dossier assembles the seven elements, each in exactly one of four states:
Statewide, 743 of 2,836 in-service Caltrans cameras (26 %) answer HTTP 200 image/jpeg with a fresh Last-Modified, and the image is a white "Temporarily Unavailable" card. 82 more return HTTP 500. A card passes the status, type, size and date checks. Only its pixels give it away.
At build, one card carried a stale burned-in date, and one District 7 camera had a Last-Modified about 1,126 h old. Neither the header nor the caption can be trusted, so the pixel test stays.
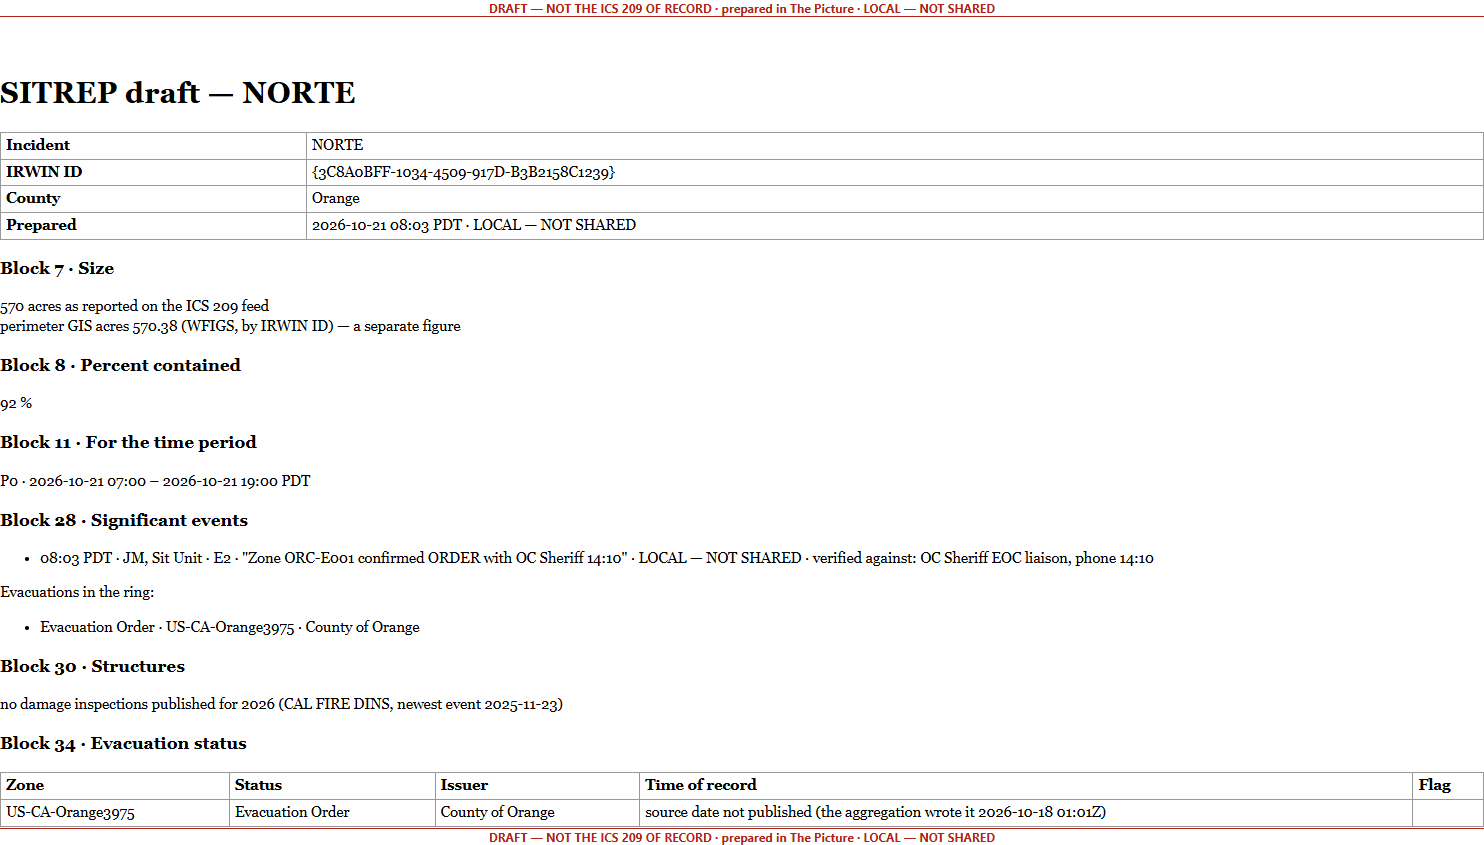
The ICS 209 is prepared "once daily or for each operational period". This draft pre-fills the blocks that public feeds can honestly answer, and leaves the judgement blocks blank for the Situation Unit to finish in its own system.
Block 7 prints the incident's 570 ac (ICS 209) with the perimeter's 570.38 GIS acres beside it as a separate figure. They are never averaged. Feed JSON downloads as cop-feed-<IrwinID>-<stamp>.json.
On both WFIGS layers, dataLastEditDate advanced about every 10 minutes while the response body hash stayed identical. Freshness therefore comes from record times, and changes are detected by a body hash.
8 of 9 Evacuation Orders statewide are Tulare flood zones last updated 2023-09-21, still published as current. Any zone more than 30 days old renders "unverified — check the issuer" and marks E2 stale.
The DINS distance query in 4326 returns HTTP 200 carrying {"error":{"code":400…}}. Any {error} body counts as a failed fetch, never as zero. There is no 2026 inspection at all (newest event 2025-11-23).
8,472 of 11,038 rows start in the future, and District 7 alone is 14.2 MB per poll. E4 counts only closures in place now, in the districts the ring touches. Emergency closures have no keyless feed, and the app says so.
Of 72 California wildfires, size was set on 31 and containment on 10. The rail and the draft print "not reported", never 0. "Hide 100 % contained" keeps the rows with blank containment visible.
Imperial, Kings, Merced, San Francisco, Alpine, Sacramento and Stanislaus publish no zones to the statewide aggregation. For an incident there, E2 reads ⊘ NO FEED HERE with the county's own link. It never reads "no zones".
The spine: WFIGS incidents and perimeters (downstream of IRWIN, never an IRWIN integration) · FIRIS perimeter versions · Cal OES evacuation aggregation + CAL FIRE status view · CHHS Open Shelters + FEMA ESF-6 · Caltrans lane closures + CCTV · CAL FIRE DINS · NWS alerts in effect at the point of origin · USGS 24 h. Not bound, and labelled: CAL FIRE's incident list (no CORS), satellite hotspots (gated three ways), July's frozen evacuation URL. Catalog: 2,553 service URLs crawled 2026-07-16, each probed when it is pinned; 16 are excluded because their names contain spaces, and the app says so.
MapLibre's compact attribution renders expanded until the first drag. The credit line ran across the scale bar and the legend while every DOM assertion stayed green. The ring label wrapped to "15 km straight-". Both are now pinned in the offline suite.
The last good data is kept, and only the freshness indicator changes: "refresh failed 08:04 — showing 08:02". The browser suite drives this and the recovery. A WFIGS feed that comes back empty shows the quiet-season line, and the map stays drawn.
The code was edited on 2026-10-22. A re-run that day: offline 479 / 479, drift OK. The live (339) and browser (288) suites have not been re-run since. Untested live: T11's evacuation rebuild window, and the 11-minute T7 slow watch, which never completed.
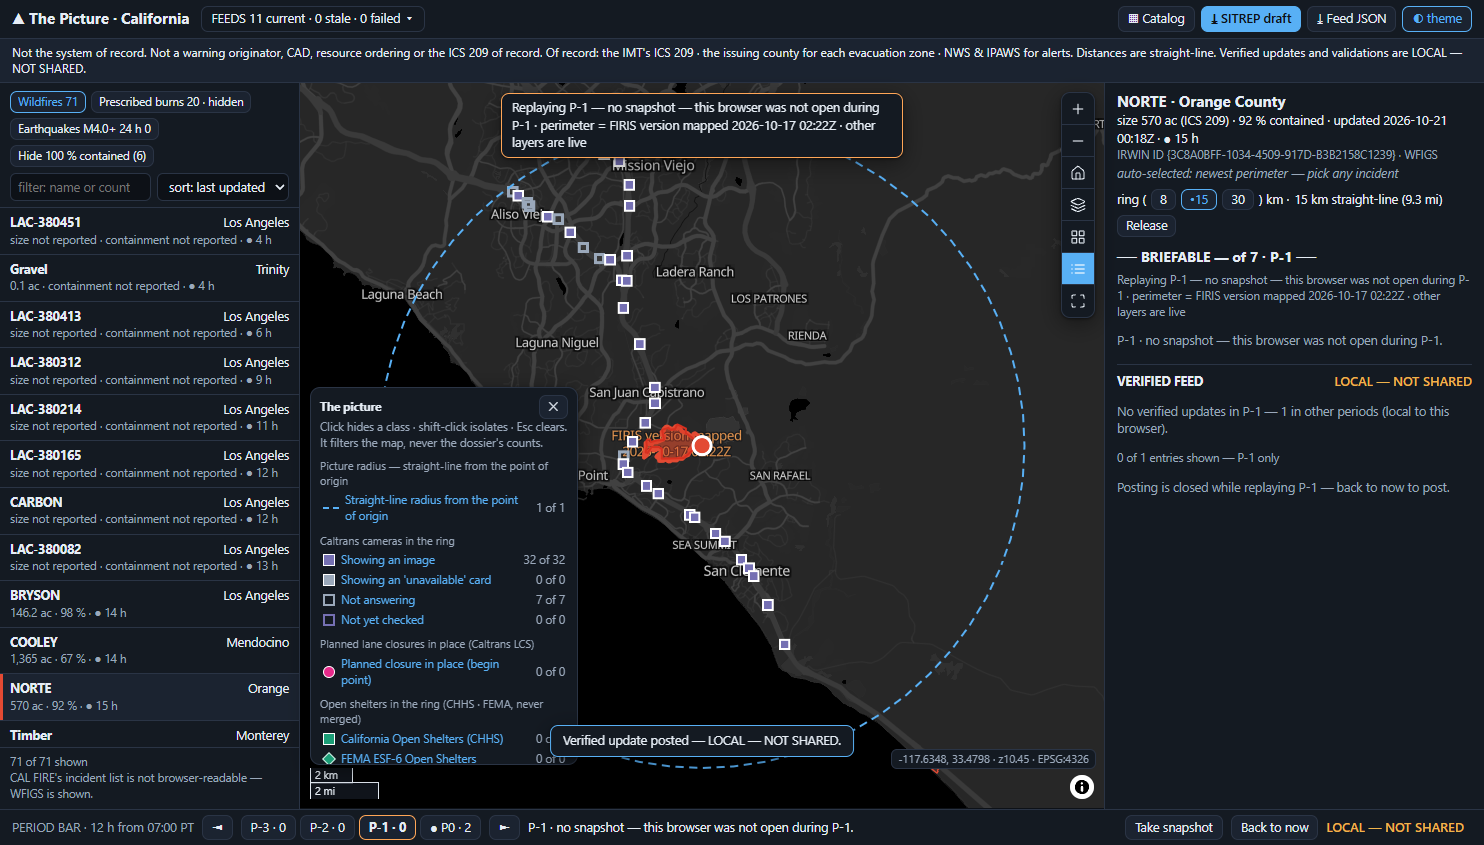
Reading the figures: every number on these slides comes from the recipe's terminal probes or from the shipped app on 2026-10-21. There is no generated data in this build: nothing is seeded. The validation and verified update in the screenshots were typed by the automated browser driver as test steps, held locally and labelled as such.
Every one of these is written into the delivered application's own README. A tool that hides its edges costs you the project it cannot finish.
Bring your incident source and the public or agency feeds that answer the seven elements where you are: perimeters, evacuation zones, shelters, closures, cameras, damage and weather. Then set your operational period, and the dossier reads your incident instead of a California wildfire.
Chosen at build, not hardcoded: the picture radius (8 · 15 · 30 km straight-line), the operational period (12 h or 24 h, and its start time), the theme, and an optional write-back to your own ArcGIS incident-log layer (specified in the recipe, off in this build). It runs alongside the WebEOC and Esri stack you already own. A watch centre near a public incident can read the same picture of that incident.