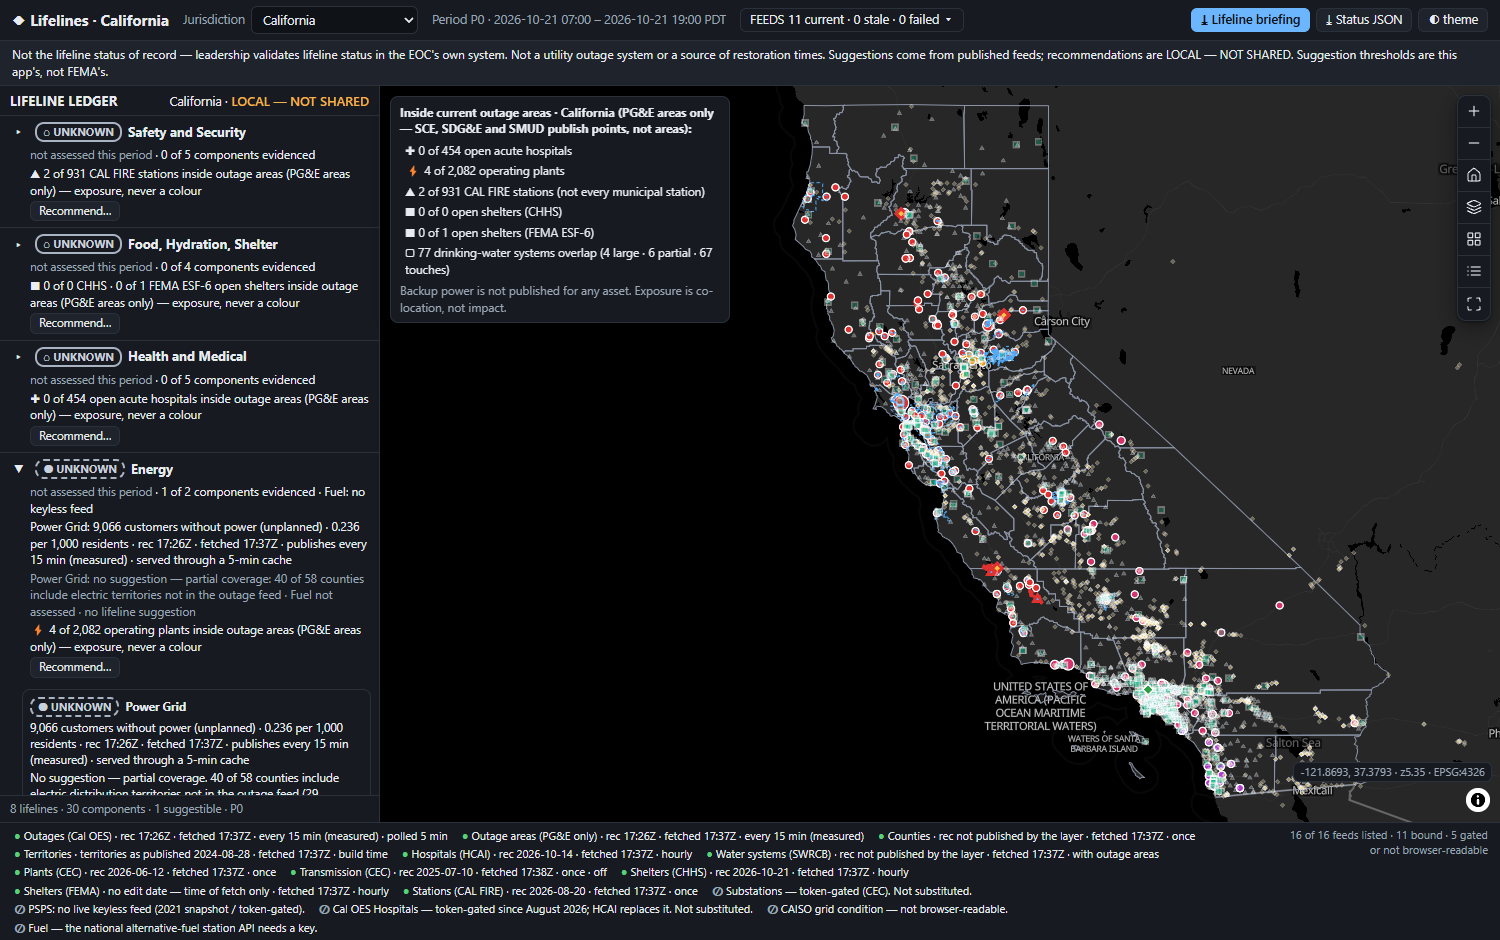
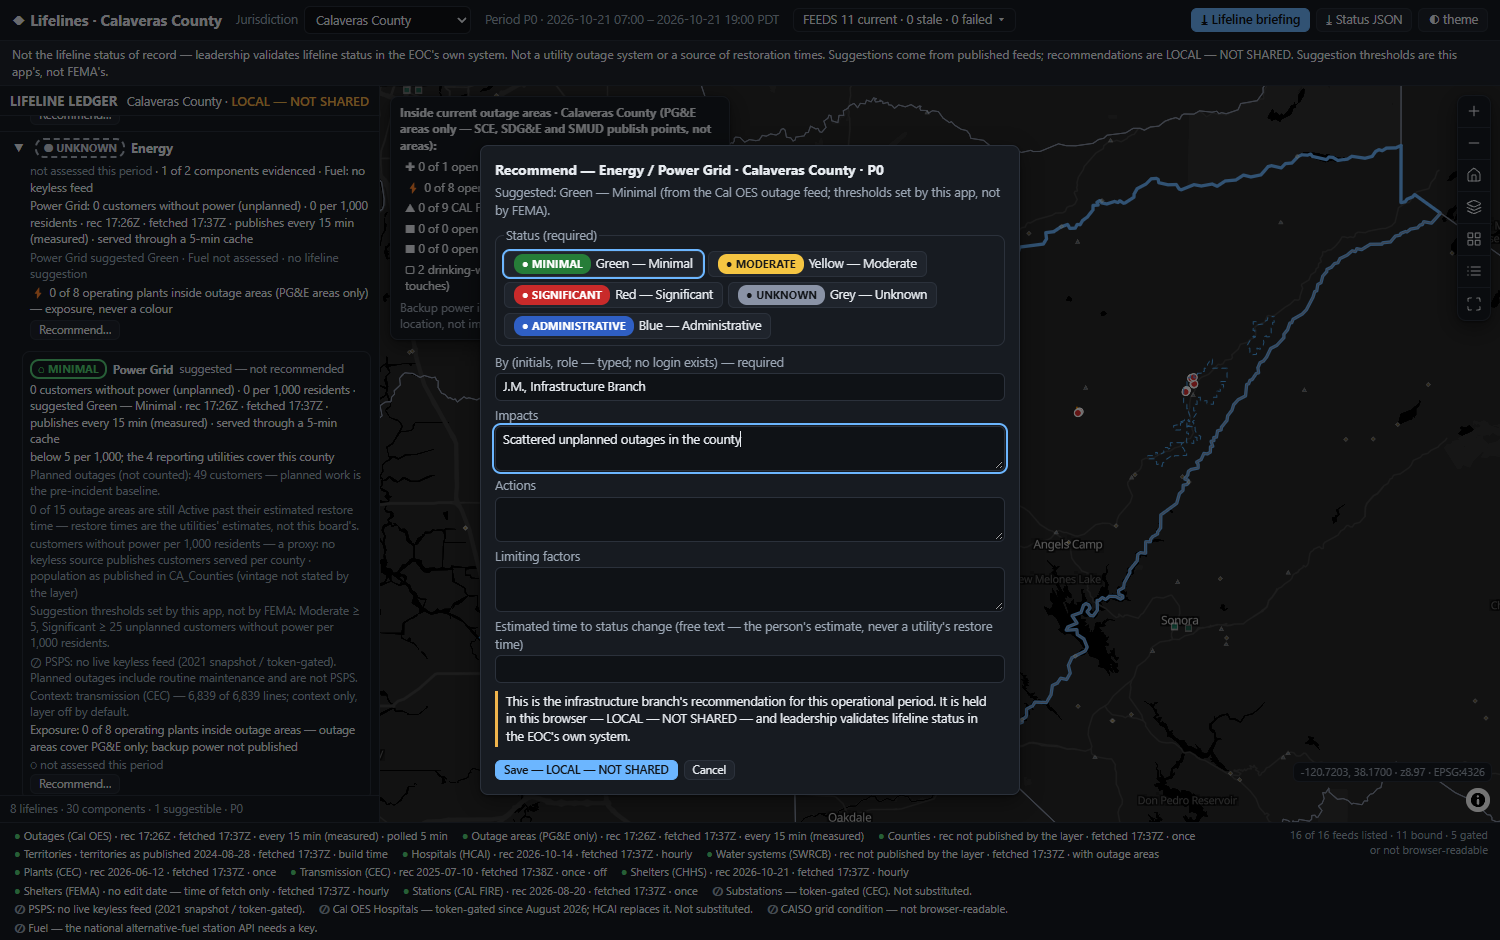
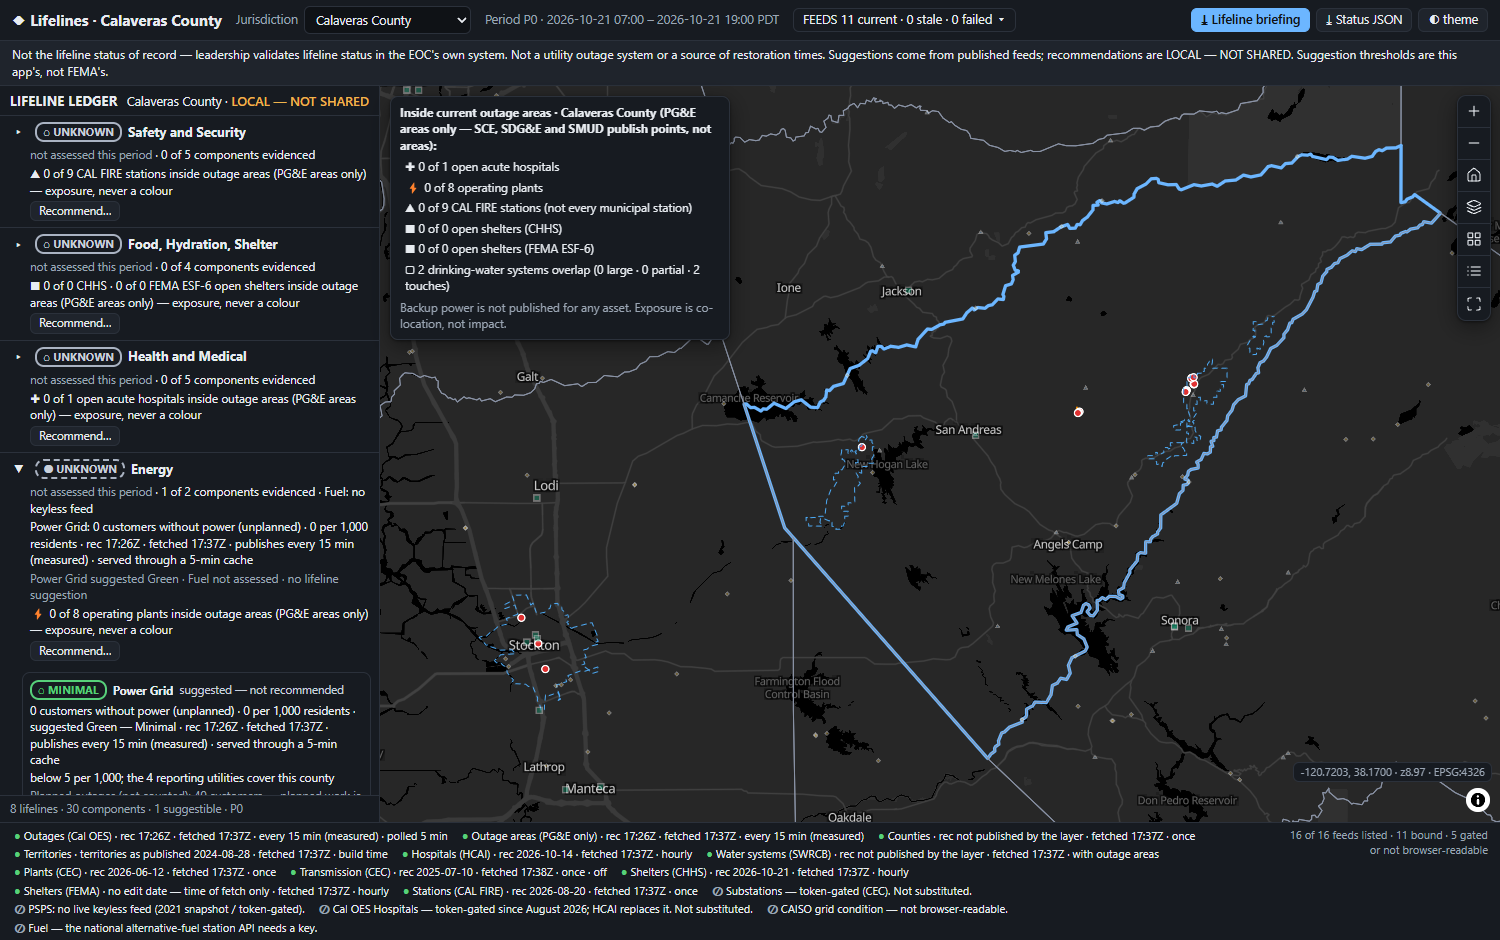
The eight FEMA Community Lifelines as a ledger of their 30 fixed components — each colour suggested only where a live, keyless feed measures an impact, recommended by a person, and shown beside its evidence and the age of that evidence.
FEMA's Community Lifelines Toolkit 2.1 (July 2023) is plain about who does what: lifeline conditions are "recommended by Situation Unit and validated by leadership". The colours mean impact against a pre-incident baseline, a snapshot of one operational period.
So the buyer's question is narrow: which of the eight lifelines is degraded here, on what evidence, and has a person confirmed the colour? The board never decides a colour, never validates one and never tasks anyone. It shows which colours have evidence behind them — and which are grey because nobody has reported.
The other 29 render grey — needs report, each with the reason no keyless feed exists. That is what the doctrine's own Grey — Unknown is for: not a failure state, an honest one.
FEMA's own 2024 doctrine-update page asks what "the standard impact data and data sources for each lifeline component" should be. Read 2026-10-21, it is unchanged: the question is still open.
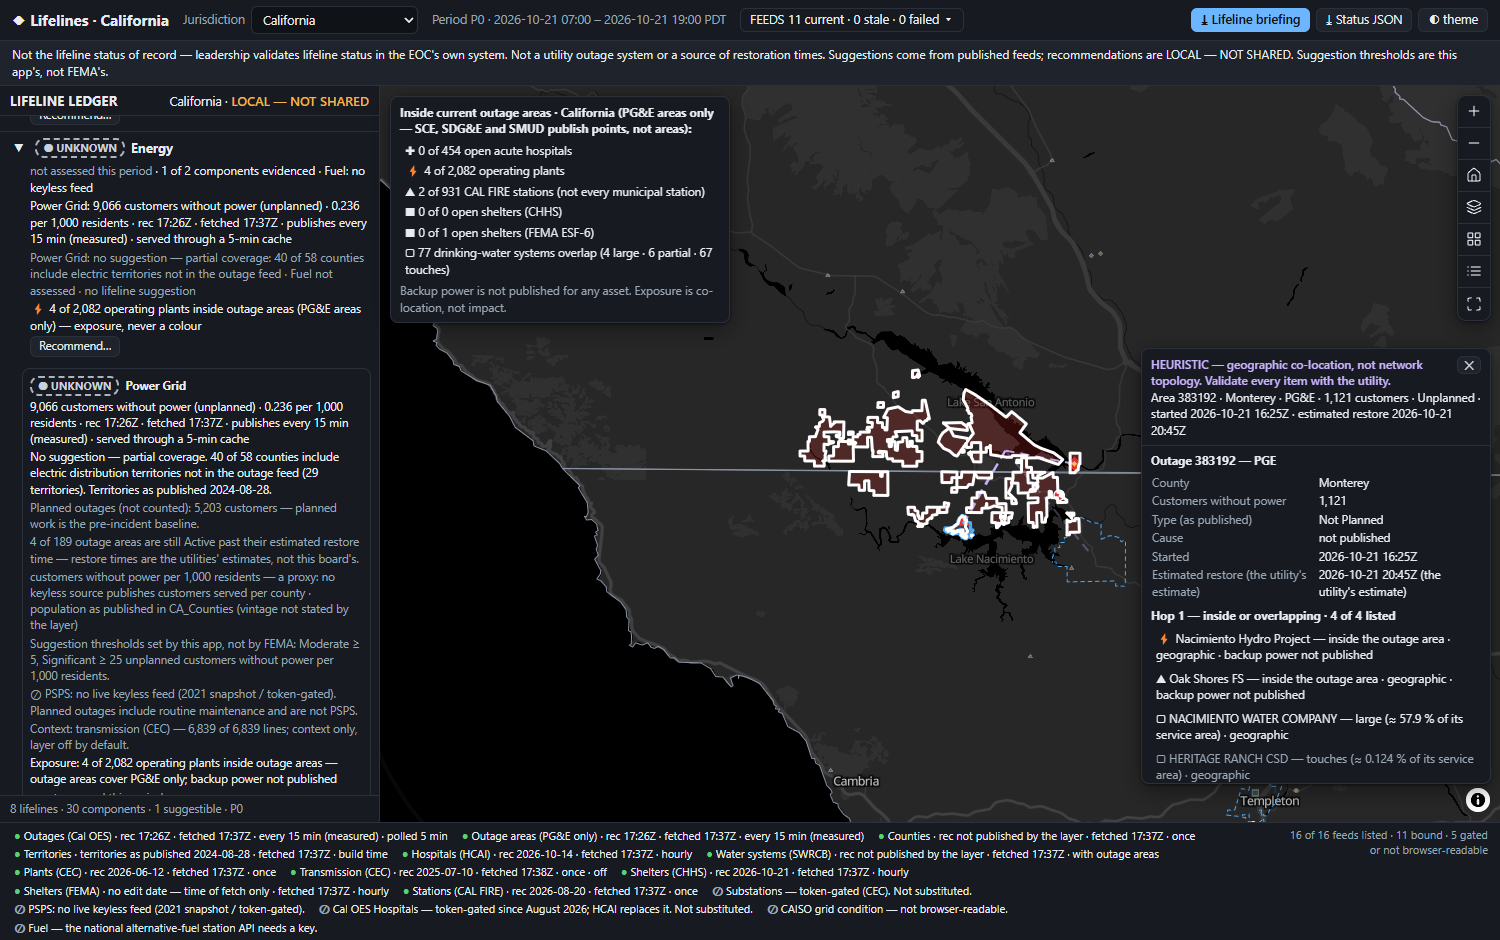
A hospital inside an outage polygon may be on backup power — and no backup-power status is published for any asset. So an asset inside an outage area is evidence under a component. It never sets a colour by itself.
The toolkit's Green means "functioning at pre-incident levels". An absence of reports shows nothing of the kind. Green is suggested only where the feed covers the whole jurisdiction, is fresh, and reads below the Moderate threshold. Otherwise: grey.
A colour is a snapshot of one operational period. Every suggestion carries time of record, time of fetch and the measured cadence; every recommendation carries who, when and which period. Stale evidence withdraws its suggestion.
Our own first version broke all three: it suggested Green from missing evidence, turned five health facilities inside outage areas into a red Health and Medical row, and fell back to a synthetic outage set when the feed failed. This rebuild exists to undo that.
| What exists | How the colour is set | Live outages × assets · cascade | Verdict |
|---|---|---|---|
| DHS S&T — Community Lifeline Status System (CLSS) | weighted indicators score human assessments; free to government, on the agency's ArcGIS Online | not described · not mentioned | The closest rival. Continued federal funding "has not yet been guaranteed" (May 2025) |
| Esri Emergency Management Operations | typed in the Community Lifelines Editor (a Survey123 form); history tab | none · no | The stack the buyer may already own — we run beside it |
| Juvare WebEOC lifelines board · D4H extension pack | typed; both list the pre-2023 seven lifelines, no Water Systems | WebEOC + PowerOutage.com overlay (Dec 2025), colours no lifeline · no | The system of record; we export what it ingests |
| CISA Gateway · INL All Hazards · Argonne EPfast | no lifeline colour | real dependency models — behind accounts, not live-outage driven | The topology. Gated, and rightly so |
| Lifelines | suggested from a measured impact, then recommended by a person — local, exported | outage × asset fusion with its caveat · a cascade lens labelled heuristic | The evidence under the colour |
CLSS gives a scored colour, Esri and WebEOC a typed one, PowerOutage.com an overlay. None says how much of the colour the evidence supports, how old that evidence is, or whether the person agreed with it.
Eight rows in the toolkit's fixed order, each holding a colour, its evidence and its agreement. A tile grid has no room for the evidence line, which is the product; a ranked list implies an order the lifelines do not have. The map is evidence, one click away.
Each row prints four parts: evidence coverage (1 of 2 components evidenced) · the measured impact and its age · exposure as evidence, with its PG&E-only caveat · agreement — agrees · overrides · no suggestion possible.
The thresholds are this app's, not FEMA's, and every screen and export says so. Coverage is an equal-area share with a 0.5 % floor, built from the utility territories: 18 of 58 counties are fully covered — the only places Green can ever be suggested.
Measured, then corrected by the build: LADWP covers 11.54 % of Los Angeles County — not the probe's 11.83 %, which counted its hole rings as covered ground. Solano / City of Pittsburg sits at 0.498 %, within 0.002 pt of the floor, so near-floor shares are re-measured on a finer grid. Worked figures: data of 2026-10-21 12:56Z.
data.ca.gov says the outage feed updates every 15 minutes. A two-read probe in the morning said 30 — reads at 11:09 and 11:30 could not see an 11:11 publish. Consecutive changes in the afternoon settled it:
A failed refresh keeps the last good data and degrades only the freshness. During the build one geometry answer arrived as HTTP 200 with ~9.4 MB of truncated JSON — now treated as a failed refresh, never as data.
Stated honestly: the suite's own cadence check (CADENCE=1, two reads ≥ 16 min apart) was not run for this build — the 15-minute figure rests on the probe reads above.
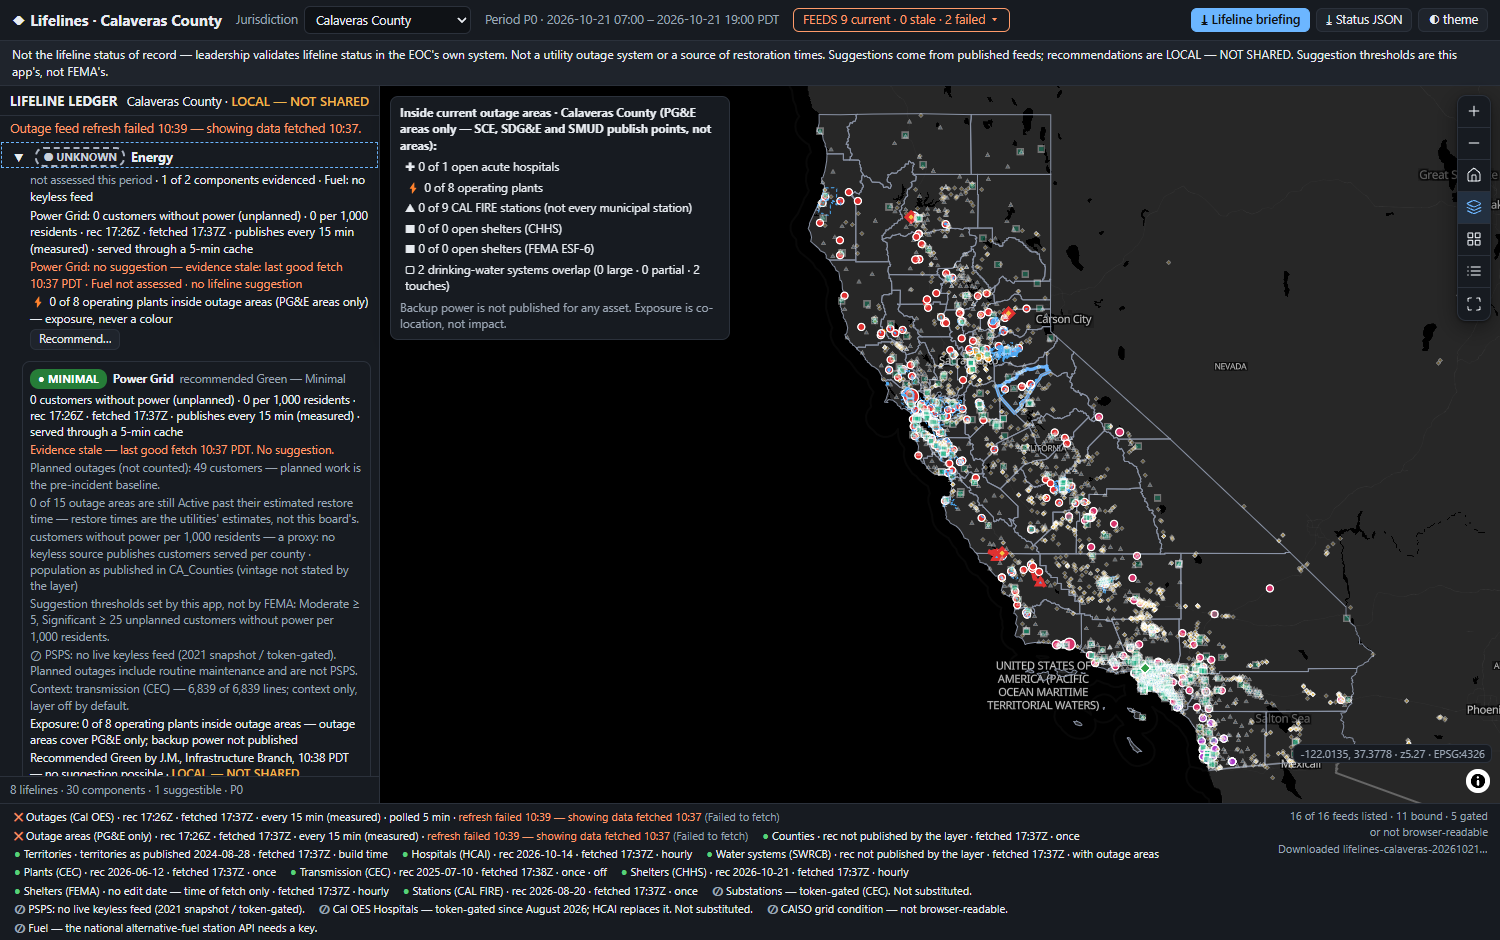
Typed by CISA's dependency kinds. Hop 1: assets inside the outage area, and water systems whose service area it overlaps — tagged large ≥ 25 % · partial 5–25 % · touches < 5 %. Hop 2: hospitals inside a large or partial system, inferred.
So touches hospitals are counted, not listed, and no population is ever summed — the naive sum across that morning's overlapping systems was 2,837,834. One system can arrive as several polygons, so systems are grouped by their number, never counted by polygon.
Areas carry PGE on 30 of 30 rows; the incident points carry four utilities. So the impact comes from the incidents, and every exposure figure says PG&E areas only.
By plain intersection, LADWP sits in Fresno County on a 0.016 % boundary sliver. Coverage is an equal-area share with a stated floor — and the territory layers were last edited 2024-08-28, printed on screen.
CEC substations, Cal OES hospitals and PSPS Current all return 200 with {"error":{"code":499}}. Read the body, label the lane gated, and never substitute a look-alike.
HCAI's is ObjectId; the water layer's is OBJECTID_1, beside a decoy integer column literally named OBJECTID; FEMA's is lower-case. Each is read from the layer's own metadata at boot.
One row, last edited 2021-04-14. Drawn as an active shutoff, it would be a lie on the map. There is no live keyless PSPS feed, and the board says so.
HCAI's facility listing advertises Create, Delete, Update to the public. The capability is not an invitation: bound read-only, paged at 1,000, with the 8 rows at (0, 0) filtered out.
The spine: Cal OES outage incidents and areas · 58 counties (an undated population baseline, Σ 38,340,074, printed as undated) · 454 open general acute care hospitals (HCAI) · 4,991 drinking-water service areas · 2,082 operating power plants · 931 active CAL FIRE stations · CHHS and FEMA ESF-6 shelters, counted by source and never summed. Not bound, each cited on screen: substations, PSPS, CAISO grid condition, fuel stations, and the dead HIFLD mirror.
A failed refresh, stale evidence and an empty feed are each forced by the browser driver and screenshotted: last-good kept, suggestion withdrawn, "No outages reported … by the 4 reporting utilities" — never drawn as zero or green.
At state view, asset markers drowned the outage areas. Assets outside an outage now draw smaller and fainter; assets inside keep full size and a red outline. The same review kept the grey basemap pair over OSM Dark, whose greens competed with the evidence.
No browser was left running through 30+ minutes of real polls; staleness is proved by advancing the clock, and the suite's own 15-minute cadence check was not run. drive.mjs needs at least one live PG&E outage area — a quiet day turns it red with no app defect.
Reading the figures: every number on these slides is from a live public service on the date named, or from the shipped app's own run. Nothing is seeded and no data is generated — the operator's recommendations start empty and stay in the browser until exported.
Every one of these is written into the delivered application's own README. A board that hides its edges hands leadership a colour it cannot defend.
Your published outage feed, the utility territories that say where it reaches, a jurisdiction baseline, and the asset layers your lifeline leads already keep. The board then shows how much of each colour your evidence supports — and how old it is.
It runs beside what you own: CLSS, Esri's Community Lifelines Editor or WebEOC keep the record; the board supplies the evidence and exports a Tier I / Tier II briefing and a status JSON. The suggestion thresholds are set when you configure it and printed as yours. For an industrial or energy operator's own centre, the same board reads the public lifeline inputs to its region.