__MK__tabaqat · StrataEmergency Management & Response
Hazard & Impact Zone Analyzer — "Impact Zone"

Set a zone.
Count what is inside.
Say how sure you are.

Draw it, buffer it, import it, or adopt a live fire perimeter, warning polygon or evacuation zone — and get structures in the ICS 209 Block 30 "Threatened" classes, people as a labelled estimate, and the named lifeline assets inside. Every count carries its method and its age, and every zone edit writes a line to a change log.

California reference implementation · live 464/0 · offline 502/0 · browser re-run pending On-prem · keyless basemaps · no API key anywhere in the app
© 2026 Tabaqat · Built on Strata — sovereign geospatial applications. Not an ICS 209 of record, a warning, an evacuation order, a damage assessment or a loss estimate. Every bound feed probed 2026-10-21.
The decision this drives

Who to warn, what to protect — and how big the response must be.

During an event, someone in the county emergency-management office has to put a defensible "threatened" figure in front of the Planning Section. The question is always the same: for this zone — drawn, buffered, imported or a live footprint — how many people, buildings and lifeline assets are inside it, and which ones?

The ICS 209 asks for exactly that: Block 30B, "the number of structures potentially threatened by the incident within the next 72 hours, based on currently available information" — and, in the same instructions, "note … if numbers entered are estimates or are confirmed." The app answers in that shape and says which it is.

Buyer: county emergency-management / resilience office Between events: the mitigation planner sizing a scenario zone
0threatened-structure counts California publishes per incident today. Cal OES's public tracked-fires layer carries ThreatenedStructures, DamagedStructures and DestroyedStructures fields — empty since 2024-04-09

The 209 asks for the number; nobody publishes it. The free tool the buyer already opens counts facilities one layer at a time and no buildings at all; the licensed stack summarises a polygon for credits and prints no estimate label.

Probed live, 2026-10-21. Read beside the incident's own 209 — never instead of it.

The finding that shaped the app

The footprints pre-date the fire that burned them. Three such facts decide the count.

The imagery

Over Paradise, every USA Structures footprint was imaged 2014-07-25 → 2018-09-10. The CAMP fire (alarm 2018-11-08) covers 99.9 % of the zone, and 9,074 of 9,075 footprints sit inside it. A test on the fire's year alone returns 0 and misses it. The real test is the alarm date against the newest imagery date.

The class

OCC_CLS = Residential includes temporary lodging, nursing homes and dormitories, and in Paradise 2,241 of 9,075 footprints (25 %) are residences of unknown type. So the 209 crosswalk runs on PRIM_OCC, and "type not published" gets its own row. It is never split between single and multiple.

The people

The footprint layer's building-population field is populated on 0 footprints in all five reference zones. So people come from FEMA NRI tract populations: areal-weighted, uniform density assumed, rounded to two significant digits (the 40 CFR 68.30 convention), and always labelled estimated.

So every number prints its imagery range, its class rule and its method. Without the burn-scar line, the app would report nine thousand threatened structures in a town most of which burned eight years ago.

Where this sits — benchmark and coexist, never copy

Others have the zone, or the summary. Nobody has both, labelled.

What existsThe zoneWhat it countsVerdict
FEMA RAPTdraw a point, line or polygon with a buffer; a shapefile; current weather warnings. A fire perimeter as the zone: not statedfacilities "one infrastructure layer at a time"; a separate tract Population Counter; no structure countFree, and already open. We sit beside it
Esri Emergency Management Operations"draw the impacted area"one infographic incl. USA Structures; population as a sum of block points; no estimate label stated; GeoEnrichment credits per runThe stack the buyer may own. This app runs beside it
FEMA Hazus 7.2a study region, on ArcGIS Pro desktopdamage, dollars, casualties, from building stock aggregated by tract or blockA loss estimator. A different question
PDC DisasterAWARE · Kontur Disaster Ninja · Everbridge · Samdeskthe vendor's own hazard model, any AOI (Kontur), or the vendor's incidentsexposure from their own grid, or your own assets onlyTriage and alerting. The zone or the inventory is fixed elsewhere
Impact Zonedraw · buffer · import · adopt a live footprinta Block 30 "Threatened" table, people (estimated, with the method) and named lifeline assets, each with its vintage and its change since the last editThe gap

No product read combines an arbitrary zone, a live footprint as the zone, and people, structures and named facilities in one summary. Only RAPT says "estimated", and no page read says how a partly-covered tract is weighted.

The silhouette

Select & Export — where the tray holds zone edits.

A light drafting table. The zone card is the select. The exposure ledger is the summary. The change log is the tray that accumulates, and the impact summary is the export. The output document is the product.

The counts follow the zone, never the map. Pan, zoom, context layers and the legend change nothing in the ledger. Only a zone edit recounts, and every recount appends one line with its time, the edit, Δ structures by class, Δ people (est.), and the assets that came in and went out.

the zonethe only strong colour on the map; the ring is hatched
estimatedevery people figure, with its method
local — not sharedthe zone, the log and the imports
stale · failedlast good kept, never shown as current
MAP core + 1 km ring, straight-line EXPOSURE LEDGER PEOPLE (estimated) 5,200 STRUCTURES · ICS 209 Block 30B 10,233 imagery 2014-07 → 2018-09 · ⚠ CAMP burn scar NAMED ASSETS ▲ 3 · ■ 8 CHANGE LOG · LOCAL — NOT SHARED + 1 km, straight-line · footprints +1,158 people (est.) +1,100 · assets in: none drawn by operator · footprints 9,075 … ⤓ Impact summary ⤓ Assets CSV ⤓ Zone GeoJSON
Schematic of the loop, filled with the recipe's reference zone D: a 66.6 km² box over Paradise plus a 1 km straight-line ring, computed 2026-10-21 (recipe §4.6). The shipped screens follow. The class bar uses the app's footprint inks: single · multiple · type not published · commercial · other · unclassified.
The application, first paint

It opens on a live perimeter, already adopted.
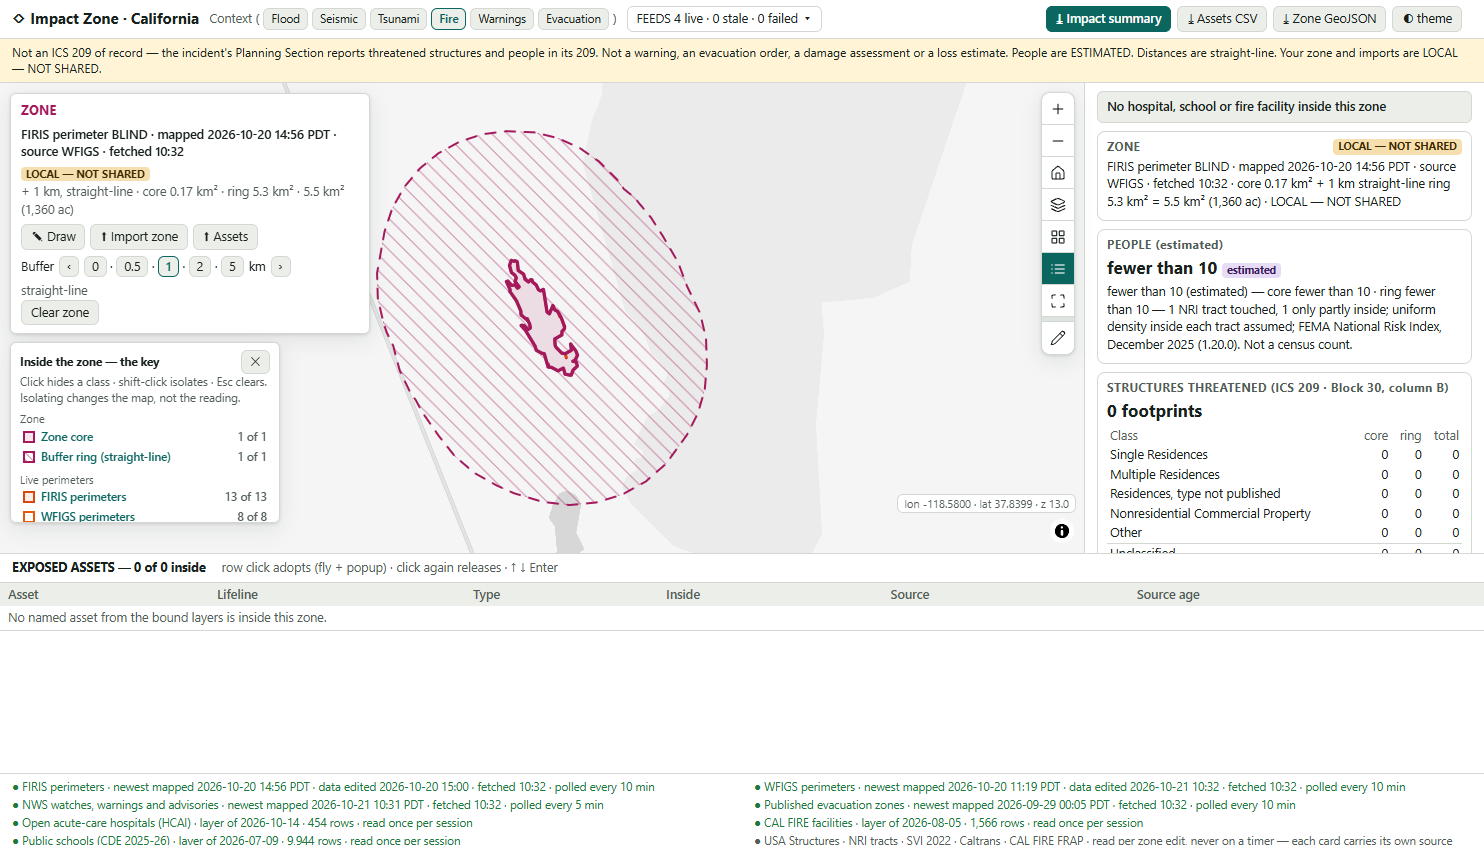
Impact Zone at first paint: the not-of-record notice bar, the zone card showing FIRIS perimeter BLIND plus a 1 km straight-line ring, the hatched zone on a grey basemap, the ledger reading fewer than 10 people (estimated) and 0 footprints, an empty exposed-assets table and the two-column feed bar.
Shipped build, 2026-10-21 — a browser screenshot written by the automated driver, not a mock-up. BLIND, Mono County, mapped 2026-10-20 14:56 PDT; zone 5.5 km².
  • A notice bar that never hides. Not an ICS 209 of record, not a warning, an evacuation order, a damage assessment or a loss estimate. People are ESTIMATED. Distances are straight-line.
  • The newest active perimeter + 1 km, adopted. The zone card carries its provenance for ever: source WFIGS · fetched 10:32, and LOCAL — NOT SHARED.
  • An honest, nearly empty reading. BLIND is a remote 43-acre fire. People: fewer than 10 (estimated), never zero. 0 footprints, listed by Block 30 class with core, ring and total.
  • Every feed shows its age. Record time, fetch time and polling cadence for FIRIS, WFIGS, NWS and evacuation zones, and the layer date of every static source.
  • Seven fixed map controls, plus Draw. Opted in, because the zone is the input.
The loop — draw a zone

Draw it, and everything inside is counted at once.
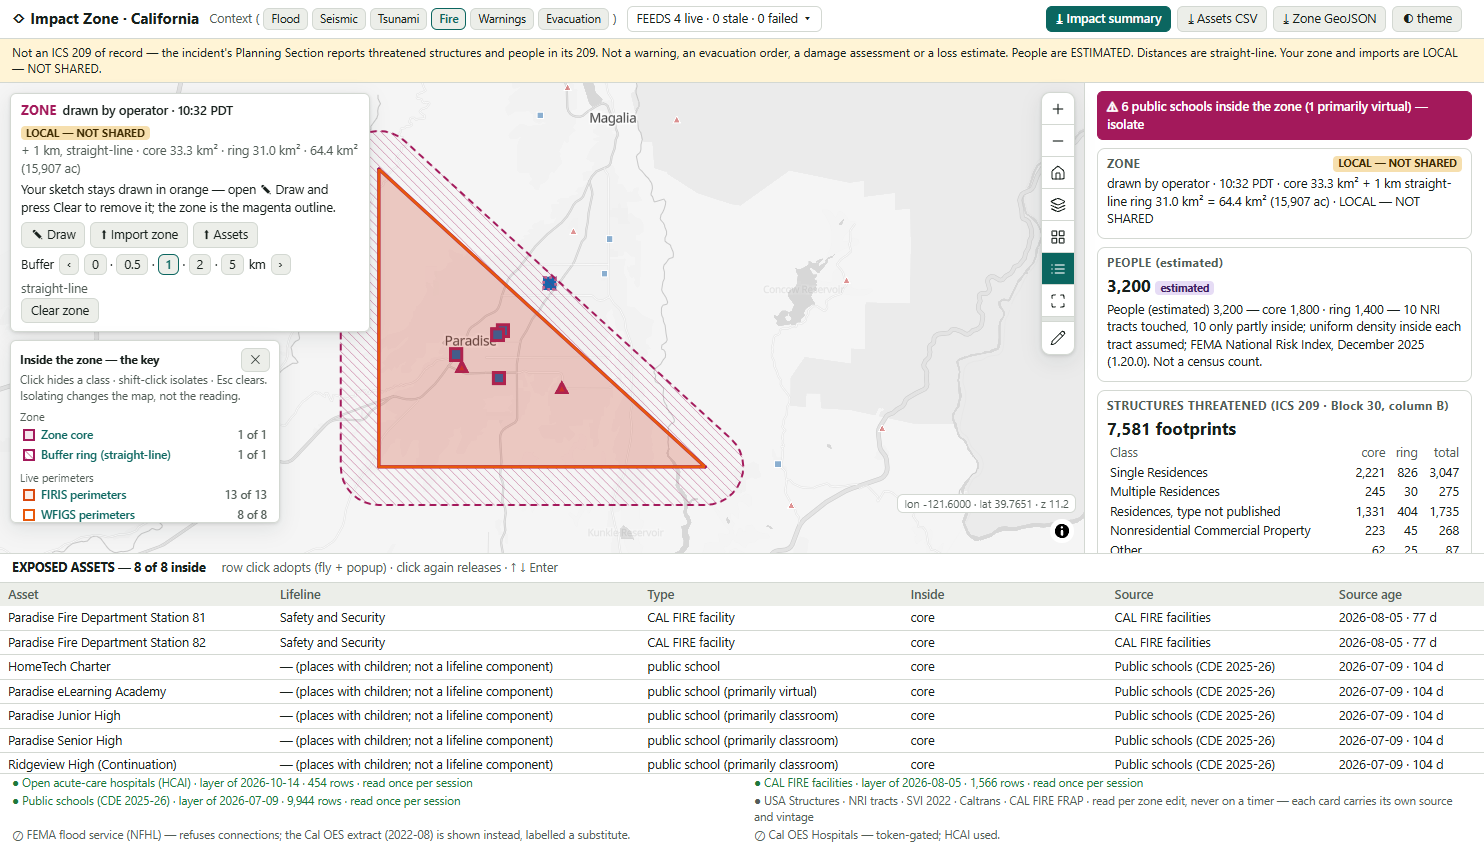
A zone drawn by the operator over Paradise with a 1 km hatched ring: the exception banner reads 6 public schools inside the zone, the ledger reads 3,200 people (estimated) and 7,581 footprints by Block 30 class, and the exposed-assets table lists 8 of 8 named assets.
A triangle drawn over Paradise (Butte County) with ✎ Draw, + 1 km straight-line: core 33.3 km² + ring 31.0 km² = 64.4 km². Screenshot by the browser driver, 2026-10-21.
Drawn by operator · + 1 km2026-10-21
People (estimated)core 1,800 · ring 1,4003,200
Single Residences3,047
Multiple Residences275
Residences, type not published1,735
Nonresidential Commercial268
Other87
Unclassified — kept visible2,169
Footprints, Block 30B shape7,581

Named assets: 8 of 8 inside. Paradise Fire Department Stations 81 and 82, and six public schools, one of them primarily virtual. The exception banner puts the schools first and isolates them in one click. People come from 10 NRI tracts, all only partly inside, with uniform density assumed and the method printed under the figure.

The tray — the change log

Step the buffer, and the log says what came in.
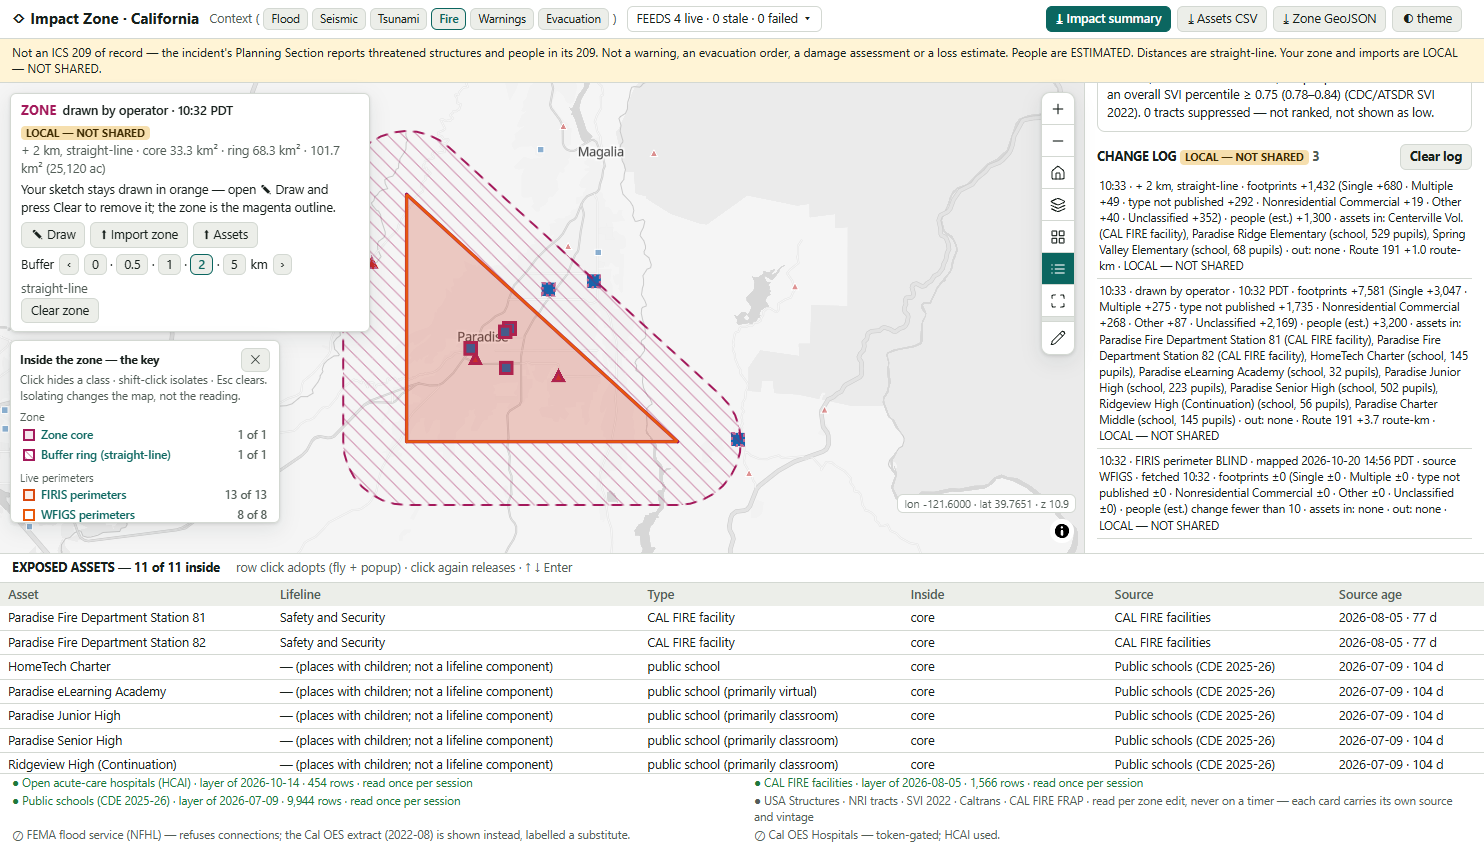
The same drawn zone stepped to a 2 km straight-line ring; the change log shows three lines, the newest reading plus 2 km, footprints plus 1,432, people estimated plus 1,300, and three named assets in; the exposed-assets table reads 11 of 11 inside.
Buffer ‹ 0 · 0.5 · 1 · 2 · 5 km ›: core 33.3 km² + ring 68.3 km² = 101.7 km². Three log lines, newest first: the adopted BLIND perimeter, the drawn zone, the + 2 km step. Browser driver, 2026-10-21.
10:33 · + 2 km, straight-line · footprints +1,432 (Single +680 · Multiple +49 · type not published +292 · Nonresidential Commercial +19 · Other +40 · Unclassified +352) · people (est.) +1,300 · assets in: Centerville Vol. (CAL FIRE facility), Paradise Ridge Elementary (529 pupils), Spring Valley Elementary (68 pupils) · out: none · Route 191 +1.0 route-km · LOCAL — NOT SHARED
Reference: the TIMBER perimeter, Monterey Co.recipe §4.6
Perimeter 102.6 km²13 · 240 est.none
+ 1 km129 · 420 est.none
+ 5 km362 · 1,100 est.Captain Cooper Elem.
Footprints · people (estimated) · the first named asset in. Computed server-side on 2026-10-21; the school holds 52 pupils.

The log is never edited and never deleted, except by Clear log, which writes its own line. It is capped at 200 lines, and the cap is stated. The whole log prints in the impact summary, so "within the next 72 hours, based on currently available information" has a record of what it was based on.

Import a zone — and read the caveat

Eleven thousand footprints, imaged before the town burned.
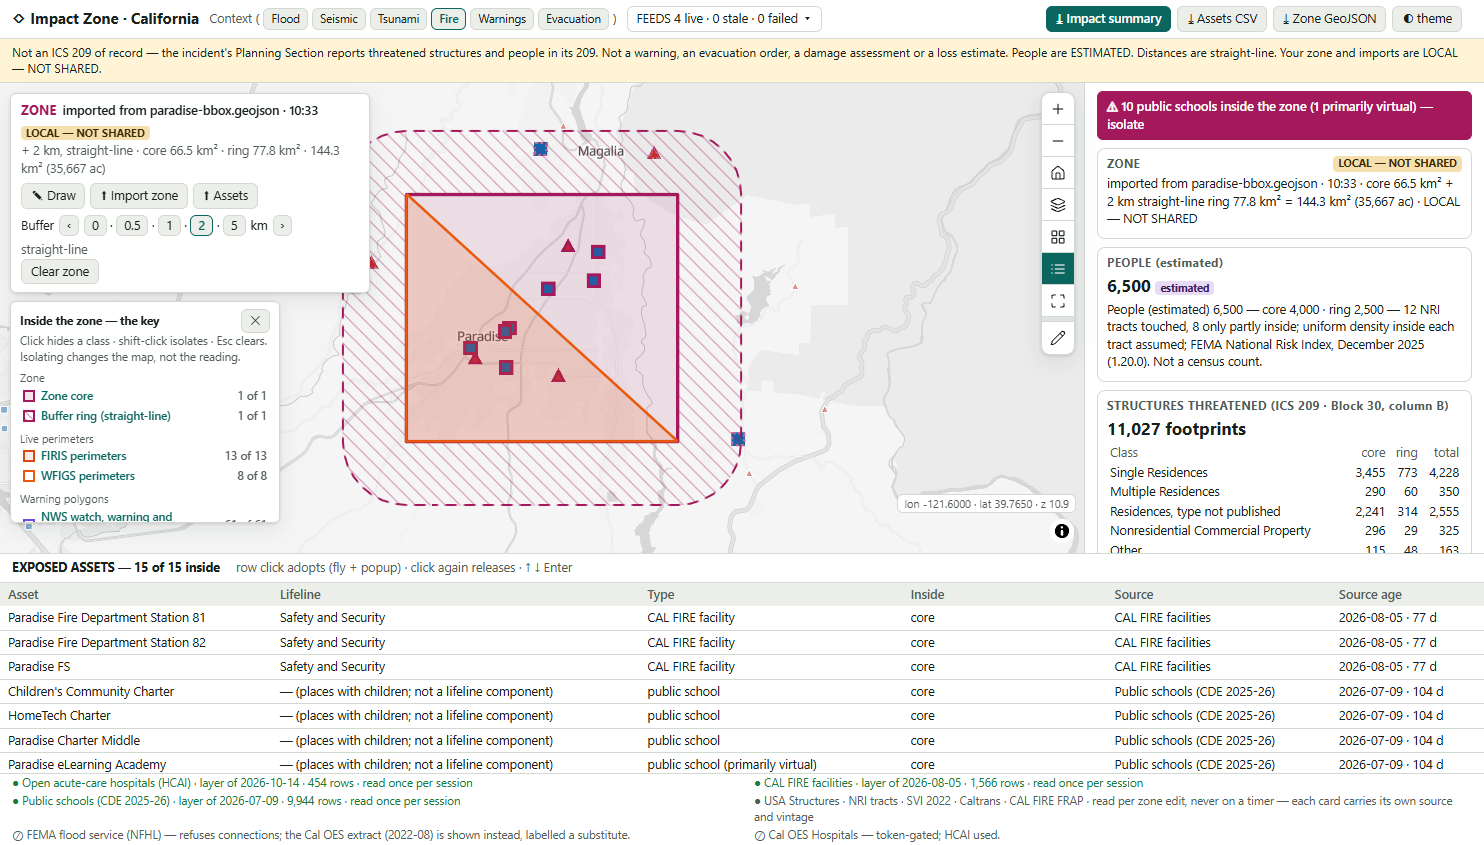
A zone imported from paradise-bbox.geojson with a 2 km ring: the exception banner reads 10 public schools inside, the ledger reads 6,500 people (estimated) and 11,027 footprints, and the exposed-assets table lists 15 of 15 named assets including three CAL FIRE facilities.
⬆ Import zone: paradise-bbox.geojson + 2 km, straight-line. Core 66.5 km² + ring 77.8 km² = 144.3 km². 15 of 15 named assets inside: 3 CAL FIRE facilities and 10 public schools. Browser driver, 2026-10-21.
Core — the Paradise box, by Block 30 rowcore
Single Residences3,455
Multiple Residences290
Residences, type not published2,241
Nonresidential Commercial296
Other115
Unclassified2,678
Whole zone (+ 2 km)people 6,500 est.11,027
The core column, as the app prints it, matches the recipe's independent server-side probe of the same box on every row the screenshot shows (recipe §4.6: 9,075 in total).
CAMP fire · alarm 2018-11-08 · 153,335.6 ac
newest footprint imagery in the box  2018-09-10
imaged before CAMP, in the + 2 km zone  10,930 of 11,027

So the structures card prints "⚠ … imaged before the CAMP fire … some may no longer stand." Damaged and destroyed counts come from field inspection, not from this app.

The California spine — all public, all keyless, every trap inverted on purpose

Published layers only. Six traps that decide the number.

A zone is 409 KB of geometry

The adopted TIMBER perimeter is 14 parts, 10,496 vertices, 409,417 characters. A GET over ~2,048 characters returns an HTML error page, which a naive client reads as "no data". Every geometry query goes by POST, and the browser suite asserts it on every request.

PROP_ST='CA' returns 0

The state field holds the full name. Filter on STATE_FIPS='06' and you get 10,931,401 California footprints. A statewide group-by failed after 56 s in the probe, so every structures query carries the zone geometry.

Six spellings of the object id

OBJECTID · ObjectId (HCAI) · GRASP_ID (CDC SVI) · FID (Cal OES SVI) · objectid (NWS) · and none declared at all (Geoportal). The id is read from each layer's metadata. It is never assumed.

FIRIS keeps every version

60 active rows, 13 newest per incident and source, 7 incidents, and name case differs (Timber / TIMBER). The adopt rule keys on the upper-cased name plus source, and prints the perimeter's own date. A distinct-values query folds case and hides the duplicate.

An empty zone is a row of nulls

An ungrouped statistic over an empty zone returns one row of nulls, not an empty list. Read as data, it is a zero with a null date. The app reads it as none, and an empty zone is a designed screen: "Nothing from the bound layers is inside this zone."

SVI hides behind -999

68 California tracts are suppressed as -999, not null. Painted naively, they become the least vulnerable. They are counted as "not ranked, not shown as low". SVI's population also differs from NRI's for the same tract, so the estimate never mixes them.

The spine: FEMA USA Structures footprints (CC BY 4.0) · FEMA National Risk Index tracts, December 2025 (1.20.0) · CDC/ATSDR SVI 2022 · HCAI open acute-care hospitals (454 rows) · CAL FIRE facilities (1,566 active) · CDE public schools 2025-26 · Caltrans state highways · CAL FIRE FIRIS and WFIGS perimeters · NWS watches and warnings · published evacuation zones · CAL FIRE historic perimeters. Flood is the Cal OES 2022-08 extract, labelled a substitute, because FEMA's NFHL refused 12 of 12 connections. Nothing is generated or seeded: every point is a published record or the operator's own import.

Proof, not promises

Built, driven and measured — 2026-10-21.

464live assertions, 0 failures, against real services with every trap inverted. Run after the last change
502offline assertions, 0 failures, with the DOM, a MapLibre stub and an injected clock. Run after the last change
322browser assertions, 0 failures, conformance 23 of 23, in real headless Chrome — before the final review pass; re-run pending
4.61lowest informational contrast ratio on any surface, in both themes. The floor is 4.5

Only the browser caught it

The "hide" filter used for the legend and the lifeline chips was silently rejected by MapLibre as a legacy filter. So Schools did not drop hospitals from the map, while the table, the chip and the DOM all said it had. It is fixed, and now pinned offline.

Core + ring = total, always

The core and the whole zone are each counted on the server, and the ring is the difference. A footprint on the boundary is never counted twice. The browser suite asserts this on live data for the adopted, drawn and imported zones.

Zero keys, pinned code

0 API keys. A zero-dependency server.mjs. Turf 7.2.0 vendored with its sha256 recorded. The map controls vendored, with the drift check OK. All 33 keyless basemaps, and no request to a deny-listed host.

Stated honestly: the last full green browser run predates a final copy-and-layout pass (the feed bar, two labels, the Block 31 line, the legend title). The re-run was stopped by the host for low memory at 155 assertions, with 5 failures traced to one harness click landing on the draw panel. That framing is fixed, but not yet re-verified. The screenshots on these slides show the post-pass layout (the two-column feed bar). Do not read the build as fully green until node drive.mjs passes again.

Stated as boundaries, not caveats

What this application will not do.

  • Beside command, never in it. Not the ICS 209 of record, not a warning, not an evacuation order. An adopted warning or evacuation zone is geometry to count inside, with the issuer's own words. It is never an instruction.
  • Threatened only. No Damaged or Destroyed columns: Block 30 C and D print "not assessed here". No dollars, damage functions or casualties. That is Hazus.
  • People are an estimate. Areal-weighted from NRI tract populations with uniform density assumed, which is wrong wherever people cluster. The app says so under every figure.
  • The footprints are old. In the places probed they were imaged 2014–2018. They over-count inside newer burn scars and miss newer construction. The count is threatened-shaped, never a field count.
  • Straight-line only. No drive time, no evacuation routing, no "nearest", no ETA, on screen or in any export.
  • Coverage has edges. The ICS 209 class crosswalk is this app's own. CAL FIRE facilities are not every municipal station, and five of the eight lifelines have no open statewide asset layer bound.
  • Flood is a 2022 extract from Cal OES, labelled a substitute, because FEMA's live flood service refuses connections.
  • One operator, one browser. The zone, the log and any imported assets stay local until exported. The app is read-only, writes back nowhere, and is English only.

Every one of these is written into the delivered application's own README. A tool that hides its edges costs you the project it cannot finish.

Point it at your jurisdiction

Your zones. Your structures.
Your assets, imported.

To point it at you, we need the live footprints you already adopt (perimeters, warning polygons, evacuation zones), a structures layer with occupancy, a tract population, and your own sites as a CSV or GeoJSON import. The same reading then counts your county's zone, not Paradise.

It drops in beside what you already run. FEMA RAPT stays open. Esri's Emergency Management Operations stays licensed. The impact summary (PDF), the exposed-assets CSV and the zone GeoJSON are built for your own systems to ingest. Every count carries the shape the 209 asks for: threatened, estimated, dated, and what changed.

tabaqat.net → Solutions → Emergency Management info@tabaqat.net
© 2026 Tabaqat · Built on Strata. Reference implementation over California, probed 2026-10-21. Not an ICS 209 of record, a warning, an evacuation order, a damage assessment or a loss estimate. Esri and ArcGIS marks are used nominatively.
1 / 13