An unattended watch wall that runs a shift on its own, ages every figure on two clocks — the feed's, and the ICS 209 record's — and interrupts itself when a high-severity change lands. Then it puts the incident in front of a person, and stops there.
A wall on a watch floor runs between activations: NIMS puts "routine watch and warning activities" at EOC level 3, steady state. Nobody is at the mouse. The one question it must answer, all shift: across the whole jurisdiction, what has changed since handover — and does anything need a person now?
The wall makes the break-in call on the glass, against thresholds the watch centre sets. A person decides what happens next, in their own systems. The wall never evacuates, dispatches, warns or orders, and it pages nobody outside the room.
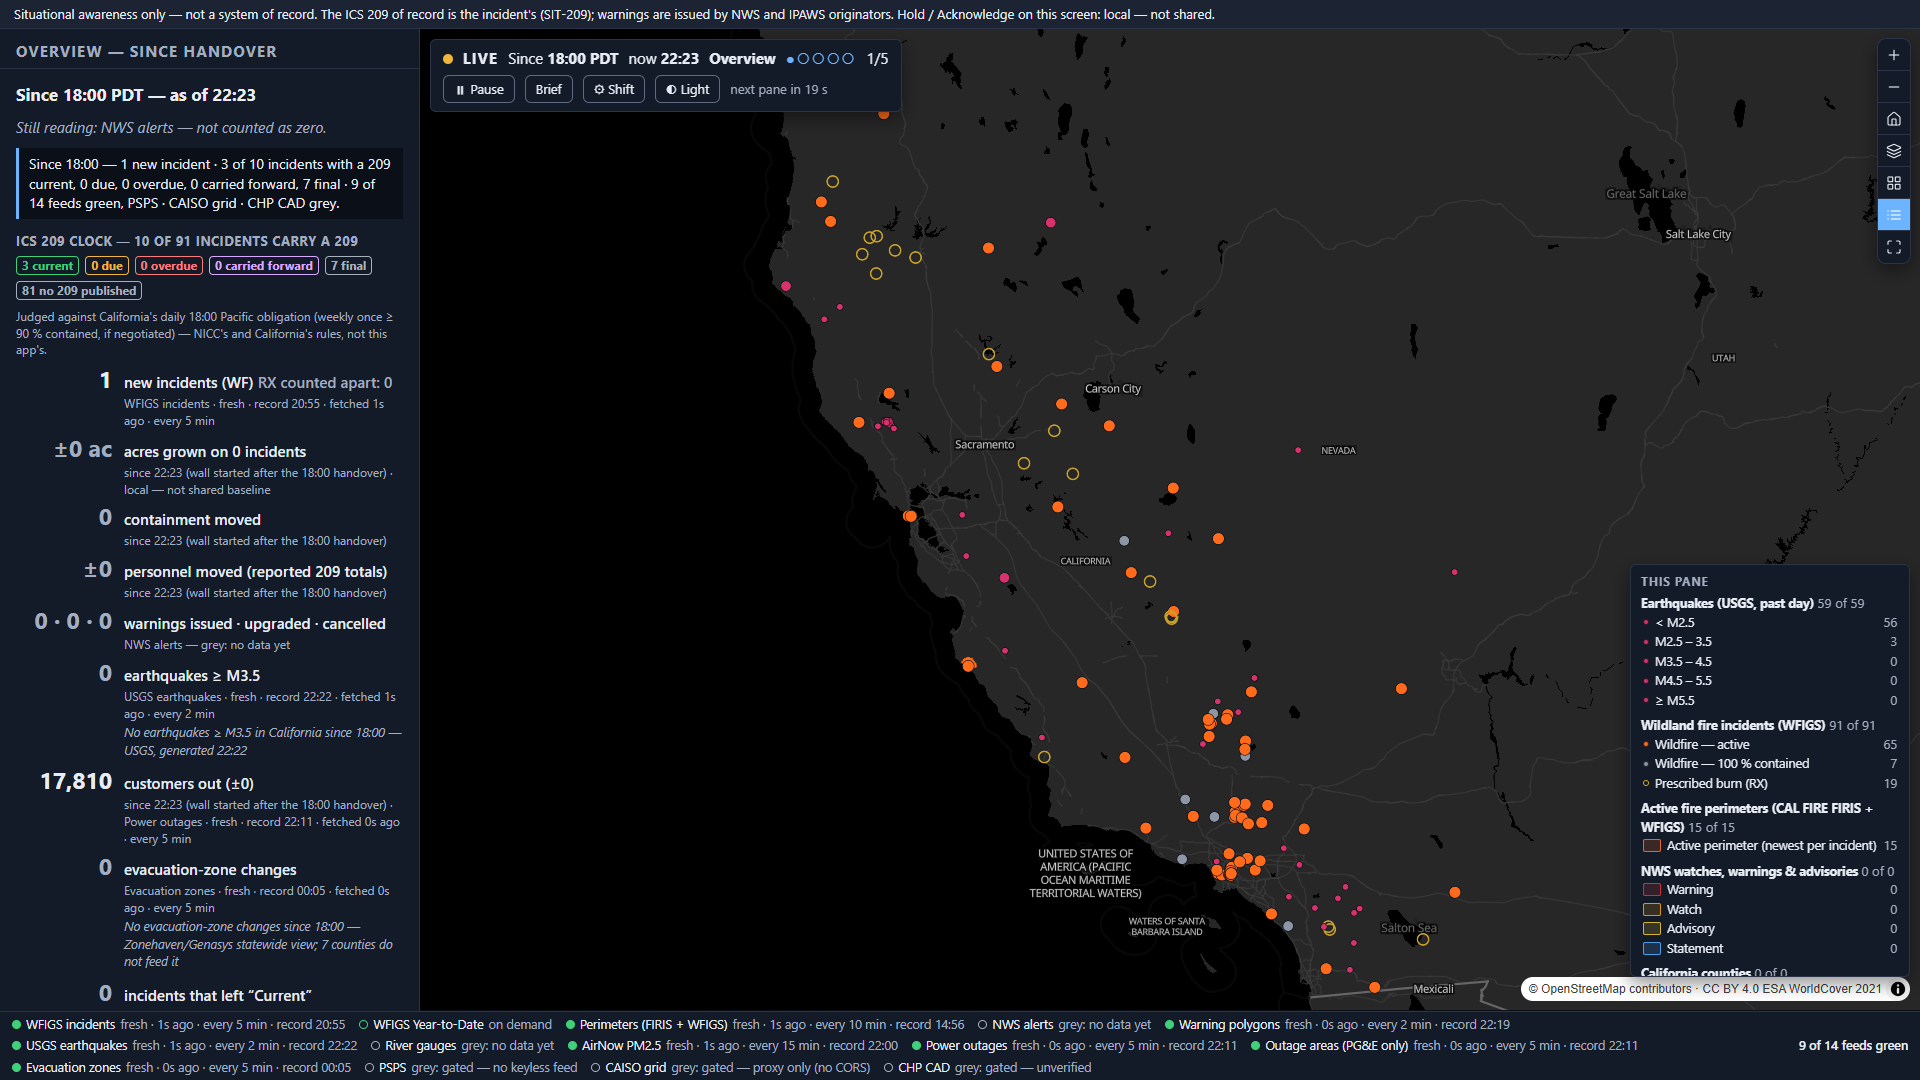
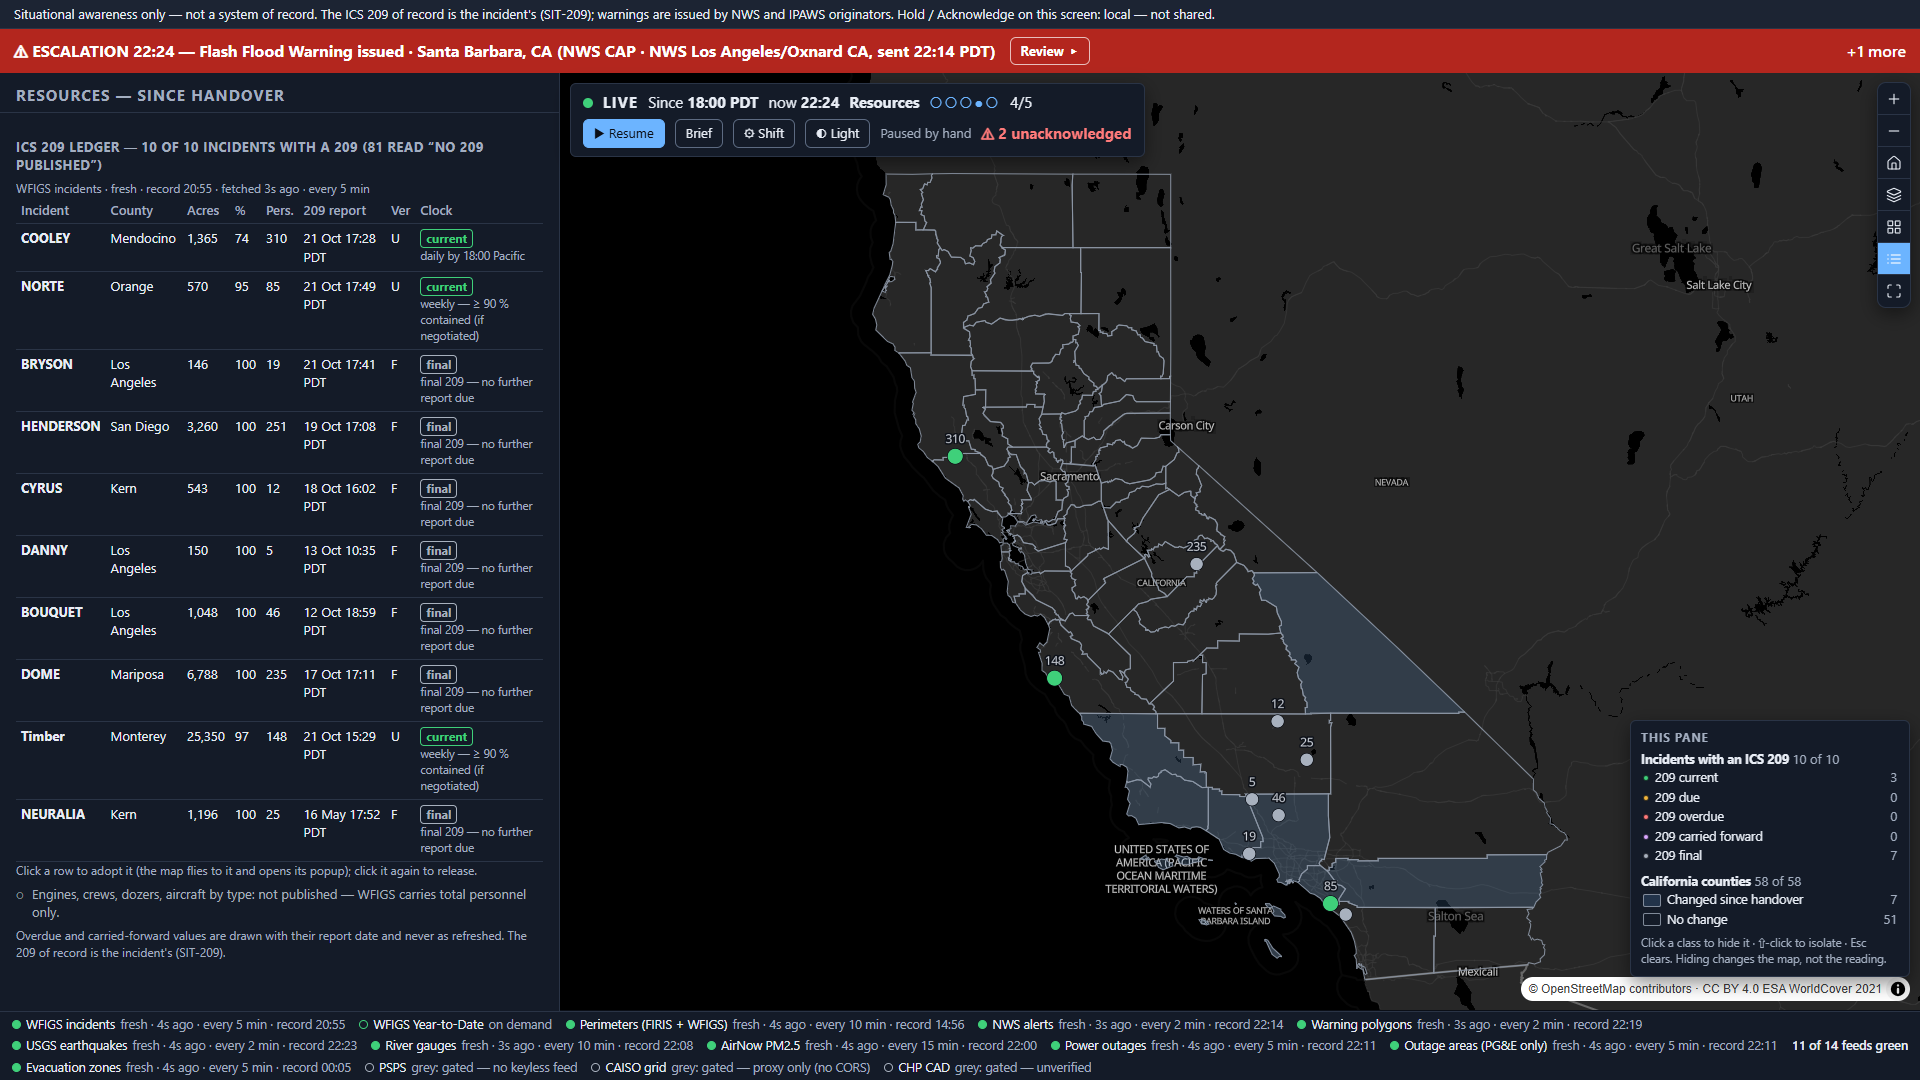
WFIGS refreshes from IRWIN every 5 minutes. The 209 inside it does not. On 2026-10-21 the NEURALIA fire's record was modified on 20 Oct — and still carried a final 209 from 16 May, 17:52 PDT.
Of 92 current California incidents that morning, 10 carried a 209 at all. The other 82 read "no 209 published", never "overdue".
Every product we read that shows age at all shows when the layer last refreshed. So a dot goes green because WFIGS answered — over a 209 that may be days old. The previous version of this very app made that mistake.
NICC already treats a late 209 as a state: values are "carried forward from the last approved ICS-209", and after six consecutive missed updates an incident leaves the national IMSR. The rule is published. No live view applies it.
A zero is not an all-clear. The NWS warning-polygon layer reads empty for 5–10 s on each ~2-minute reload — 4 of 44 probe reads. The quake feed is a rolling 24 h window: 172 → 162 with no event ending.
So every figure carries two clocks — did the last poll succeed against that feed's cadence, and is the reported number current against its obligation to report — and a drop to zero needs a second read before it means anything.
| What exists | Rotates unattended | Shows age | Interrupts itself | Verdict |
|---|---|---|---|---|
| Esri ArcGIS Dashboards · Emergency Management Operations | not stated | the feed clock — "Last update" of an element's layer | not stated | The stack the buyer may already own — this wall runs beside it |
| Juvare WebEOC · Intterra · Veoci | not stated | not stated | not stated | The systems of record and fire COPs. Coexist, never replace |
| Grafana playlists · Power BI page refresh | Grafana yes · Power BI none documented | Power BI: to the author only, 30-min floor on shared/Pro | a playlist stops when someone presses Esc | The in-house wall — the real alternative |
| Everbridge VCC · Dataminr · Samdesk · Watch Duty | not stated | not stated | alerts people — not a wall | Detection feeds for a wall, with no 209 content |
| NICC IMSR · CAL FIRE incidents | — | one timestamp a day · no per-incident update time | — | The free 209 roll-up the duty officer already opens |
| The Watch Wall | yes — five panes | two clocks, on every figure | yes — by severity | The gap |
On every product page read (2026-10-21), no product pairs timed rotation with an interrupt that breaks it — and none shows how old a reported number is against the obligation to report it. "Not stated" means the pages read do not say.
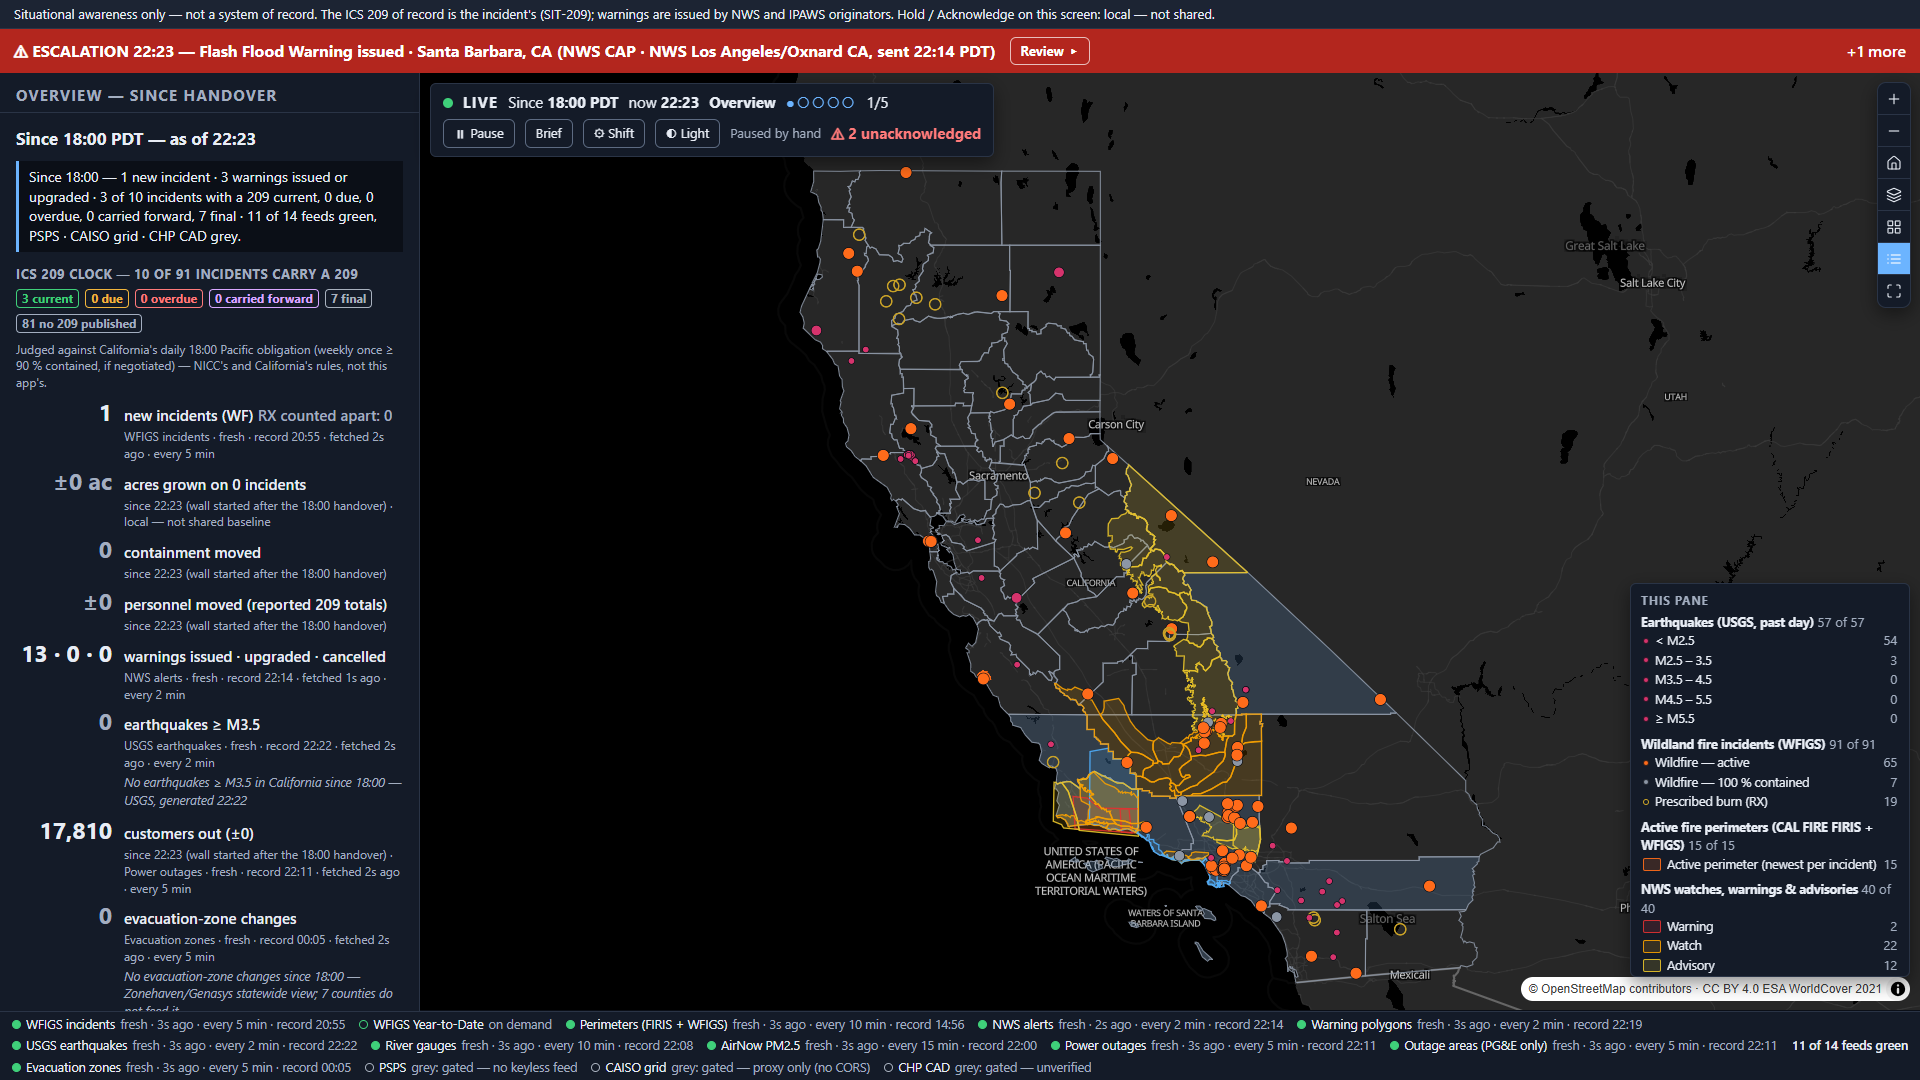
A headerless dark kiosk — an airport departures board for disasters. One full-bleed map is shown on every pane, reframed by each pane: overview · by area · weather & hydrology · resources · power. The escalation pane exists only while something has fired; rotation never visits it.
The standard map controls sit top-right on every pane. No tools and no scale bar — nobody measures, draws or prints at an unattended wall, and the wall computes no distance. The basemap pair is vt-gray / vt-gray-dark, because 40/255 polygon fills vanish on a colourful ground.
Snap → dwell → resume. The wall flies the map to the trigger, frames it in the banner colour and dwells 2 × the pane dwell (40 s by default). Then rotation resumes — and the banner stays, with "⚠ 2 unacknowledged" in the strip, until someone acknowledges.
At 09:31 PDT on 21 Oct NWS sent a Tsunami Warning, severity Extreme, San Diego to Alaska — with CAP status: "Test". /alerts/active leaves tests out; the 7-day /alerts history does not. Now only Actual counts: that day, 257 kept, 1 left out.
Feeds answer on their own clocks, so first-fired-first put a fire's growth (BRAVO, in the fixture) ahead of a Red Flag Warning. The product owner ruled on 2026-10-21: most severe first.
A more severe arrival takes the screen unless the current one is held; the displaced item goes back in the queue, unacknowledged, and the log says what displaced it. Hold and Acknowledge are labelled "local — not shared": a second screen in the room does not know.
The trap a naive rule falls into: judged "daily by 1800", HENDERSON and NEURALIA would both read overdue. Neither is — ICS209ReportStatus = 'F' means no further 209 is due.
The four update reports probed on 21 Oct landed 17:10–17:57 PDT — the deadline is read on the Pacific clock, DST-aware. Weekly applies at ≥ 90 % contained "(if negotiated)": the app cannot see the negotiation, and says so on every chip.
WFIGS answers a GET over ~2,048 characters with HTTP 404 and an HTML page — not 414, not an ArcGIS error. The first departure join reported 12 of 92 because the 404s parsed as "no match". IN-lists go by POST; HTML is a failed poll.
NWS warning polygons answer HTTP 200, count 0 for 5–10 s of each ~2-minute reload — indistinguishable from "no warnings". A zero after non-zero is held as "re-checking" until a read ≥ 15 s later agrees.
USGS's past-day feed is a rolling window: 172 → 168 → 166 → 162 with no event ending. The California bounding box also catches Nevada and Baja — quakes are clipped to the 58 county polygons.
The Cal OES PSPS "Current" layer answers HTTP 200 carrying {"error":{"code":499}} — token required. The "Active" layer is a single 2021 row. PSPS is a grey chip with its citation, never a substitute.
Eight Tulare Evacuation Order zones were last updated 2023-09-21 and are still published. Any order older than 30 days reads "unverified — check the county" and never counts as a change.
Cal OES outage counties are UPPER CASE — the wall read "17 of 58 counties changed" one minute into a shift until the compare was case-folded. NWS alerts join on SAME codes, never areaDesc.
The spine: NIFC/WFIGS incidents (Current + Year-to-Date) · CAL FIRE FIRIS+WFIGS perimeters · NWS CAP alerts and WWA polygons · USGS quakes · NWS river gauges · EPA AirNow · Cal OES outages (points, county totals, PG&E-only areas) · CAL FIRE statewide evacuation view · CA Geoportal counties. Grey, with citation: PSPS (gated), CAISO (no CORS), CHP CAD (unreachable). Every bound feed probed 2026-10-21 and re-probed at 13:13Z before any code.
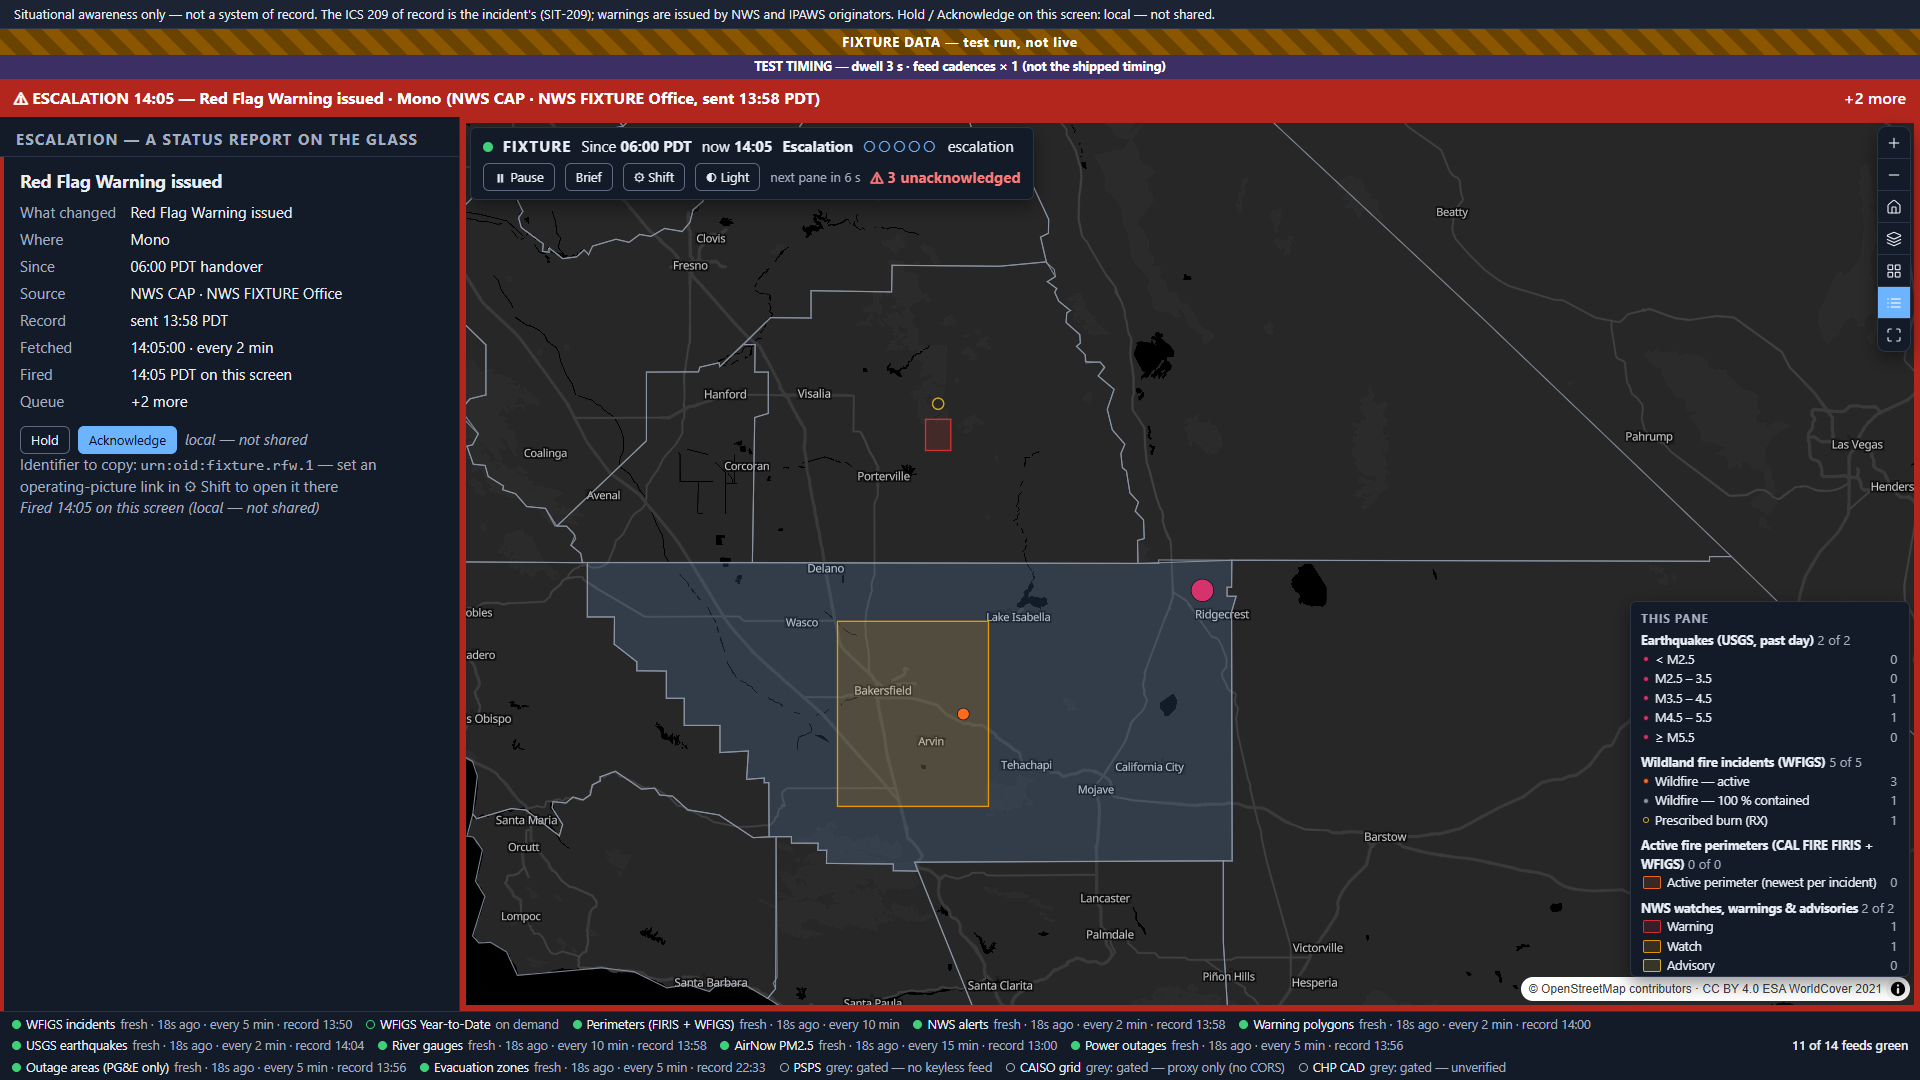
The 30-minute accelerated run passed on the final build (142 / 0): 5 panes cycled, 7,602 polls; map sources 14 → 14, layers 276 → 276, the wall's own DOM 288 → 288, features painted 289 → 289. Accelerated timing on the fixture.
The false "Quiet since 06:00" on first paint, "17 of 58 counties changed", the legend under the open drawer, the feed bar wrapping to four lines at 1920 px — found in screenshots or the browser suite. Every non-visual suite was green over each.
One live run made during the soak, on an earlier build, reported 169 / 170; its log was not kept and three reruns were 170 / 170. It is recorded as unexplained, not guessed at. Legibility at 15 ft on a 4K panel was judged, not driven (1920×1080 and 390 px were).
Reading the figures: live screenshots and counts come from public feeds on the dates named. Nothing is seeded — a quiet shift is a designed pane. Synthetic fixtures (every name starts FIXTURE) exist for the tests only and paint a "FIXTURE DATA — test run, not live" band whenever they are on; the slides that show one say so.
Every one of these is written into the delivered application's own README. A wall that hides its edges trains the room to trust a green dot.
An incident feed that carries its own report clock, the warning and hazard feeds you already watch, your jurisdiction's boundaries — and the handover times and escalation triggers your watch floor works to.
Set on the wall, not in code: handover times, pane dwell and the escalation thresholds live in the ⚙ Shift dialog. The feeds are one registry; each carries its cadence and its time-of-record field. It reads ESRI services and runs keyless — beside the Dashboards, WebEOC or Grafana wall you already own, not instead of it.