At which published level
does this asset change band?
A portfolio scored against the severity levels a jurisdiction actually publishes — one peril at a time, on that peril's own ladder. And the number nobody else reports: the assets for which no published level exists at all.
Which assets get a survey, a repricing, or an exclusion.
Every credit and climate-risk policy is written at one severity level — almost always "1-in-100". That is a statement about one line on one map. This app names the assets that sit close enough to that line for the choice of line to be the whole answer.
The buyer of record is the lender, not the insurer: the person who signs the physical-risk methodology note under IFRS S2 ¶29(c) — the amount and percentage of assets vulnerable to physical risk — and who must disclose, under ¶22 and ¶25, the inputs, the assumptions and the significant areas of uncertainty. A screening output that cannot name the map, the panel date and the severity level behind each classification is not evidence for those paragraphs.
Of 41 assets inside the state's 200-year outline, 27 are invisible to a 1 % screen.
That crossing exists only because California publishes a rung between the two FEMA levels — and because SB 5 made it a legal threshold rather than a modelling choice.
The perils do not share a severity axis.
Flood steps three times
1 % annual chance → 200-year → 0.2 % annual chance. Three published levels, and a band change between them is a published fact the state drew — an asset is inside a polygon or it is not.
Earthquake steps twice
475-year → 2,475-year, read off a continuous ground-motion grid. A band change there depends on class breaks this app chose, so every quake band carries its break set and the raw value beside the degree.
Wildfire does not step at all
Fire Hazard Severity Zones are an ordinal hazard class under PRC §4201–4204. No annual probability, no recurrence interval. The ladder has one rung and cannot be stepped.
There is no year at which all three perils have something to say. A combined score "at 1-in-100" is therefore a fiction — so the app scores per peril and refuses to combine, structurally, not by a rule someone has to remember.
The control is the ladder — and it is the primary control on the page.
FEMA / Cal OES DFIRM panels
USACE Comprehensive Study · 2002
FEMA / Cal OES DFIRM panels
CGS Map Sheet 48 · 2025, on the USGS 2023 NSHM
the same grid, five times further out
CAL FIRE / OSFM Fire Hazard Severity Zones
SRA 2023-09-29 ∪ LRA 2025-03-24
Step a rung and the portfolio re-scores in place: the map reclasses, the KPIs move, the distribution shifts, the ranked list reorders, and a band-change counter names the assets whose classification moved. ← / → step from anywhere on the page; the chevrons disable at the ends of a ladder rather than wrapping.
The gap is not "nobody publishes a return period."
Two vendors do.
| Product | What it emits | Return period exposed? |
|---|---|---|
| Jupiter Intelligence — ClimateScore Global | asset-level metrics, seven hazards, IPCC scenarios to 2100 | Yes — its own 2/5/10/20/50/100, extended to 200/500/1,000 for flood & wind |
| Moody's / RMS — Climate on Demand Pro | hazard and financial-impact scores, RCP and NGFS scenarios | Yes — its own damage ratios at chosen exceedance probabilities |
| XDI — Climate Risk Engines | VAR% / MVAR% — technical premium as a share of replacement cost | No — the opposite: severity is integrated away into an annualized figure |
| Climate X · First Street · HazardHub · ZestyAI | loss metrics, a 1–10 Flood Factor, A–F letter grades, annual probabilities | No, or opaque at the surface the buyer sees |
| This app | a band per asset per published rung, with the map and vintage that drew it | The jurisdiction's own rungs — including the ones with nothing on them |
Procurement, not capability
Every product above is delivered as SaaS or an API. Using one means transmitting the asset register — where the assets are and what they are worth — outside the institution. None publicly documents an in-perimeter deployment.
Harmonisation, which is the number
Every vendor that steps return periods steps its own harmonised grid. That harmonisation is a model output — and under IFRS S2 ¶22/¶25 it is exactly what the preparer must disclose and defend. A model grid is not an answer to a question about a panel.
The two ladders are not equally informative.
9.2 % of the register changes band on the flood ladder. 94.2 % changes band on the earthquake ladder — and 1,828 of those 1,883 step exactly one MMI degree.
A band-change count is therefore a discriminator for flood and noise for earthquake. So the earthquake rungs carry a permanent line saying that near-total movement is an expected property of reading a continuous field five times further out — rather than letting the reader mistake it for a finding.
This is the second, independent reason the app emits no combined score. The first is that the ladders share no rung. The second is that even where both speak, they are not saying things of the same weight.
Every band names the map behind it.
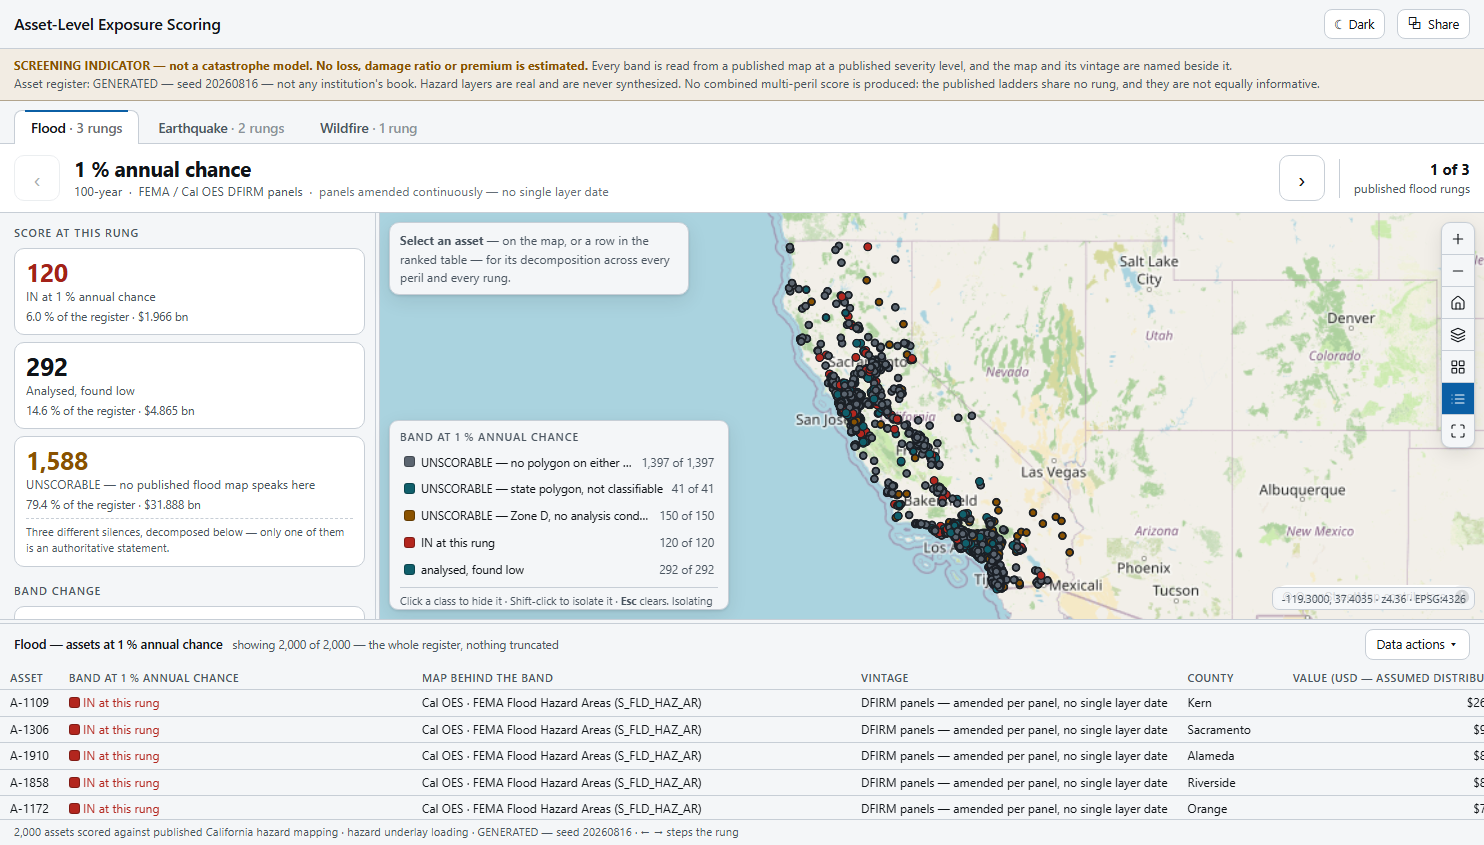
- The rung, with its authority and vintage. On screen always: 1 % annual chance · 100-year · FEMA / Cal OES DFIRM panels.
- A persistent notice bar. Screening indicator · no loss estimated · the GENERATED register with its seed · no combined score — never the status line, which is transient.
- Three KPIs per rung, each with a count, a share of the register and a value. Clicking one isolates the population it counts.
- The legend filters, and counts. Click hides a class, shift-click isolates, Esc clears — a real map filter, never a fade. Rows keep n of N.
- The ranked table carries provenance — map behind the band, vintage, county, value, and GENERATED — seed 20260816 on every row.
Counts about what the jurisdiction published — including its silences.
= exactly 0.5 % of California's published building exposure
$7,743,807,739,479 across 9,106 FEMA NRI tracts
band movers, 1 % → 0.2 % 184 (9.2 %) · $3.17 bn
inside the 200-year outline 41 — of which 27 outside the 1 % SFHA
no published wildfire recurrence 2,000 (100 %)
The silence is reported as a count, not filled. Every benchmark closes that gap by modelling it. Reporting "no published level exists here" as a first-class number, with its citation, is the honest move — and the one a disclosure preparer can cite under ¶22/¶25, which require uncertainty to be disclosed, not resolved.
Unscorable is never low. It is hatched, drawn above the low band in the legend, and decomposed into its three causes — because only one of the three is an authoritative statement.
Step the rung, and everything re-scores in place.
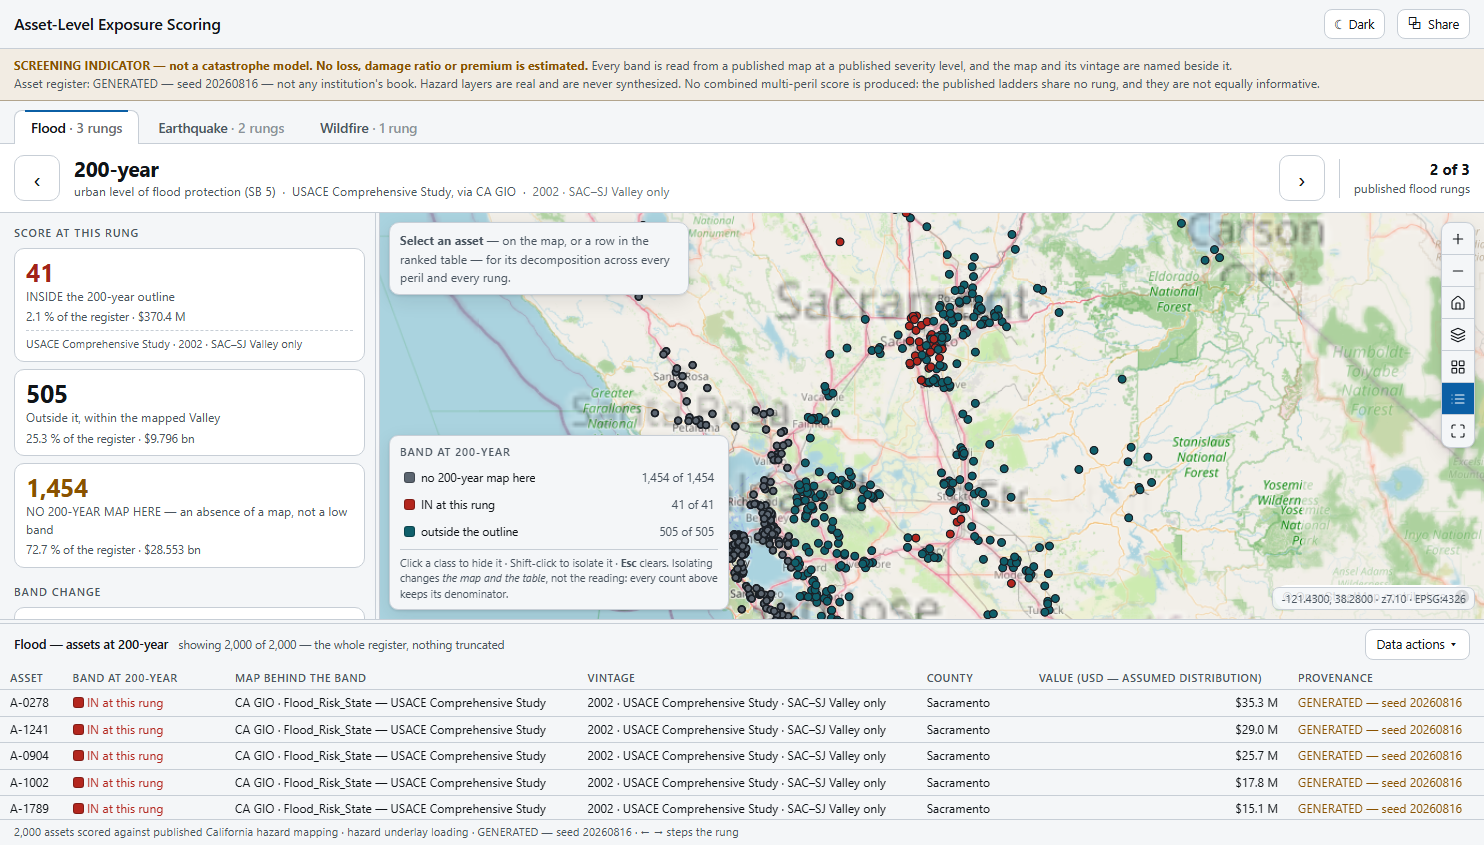
The rung is the primary control; selection is the second loop. Click an asset — on the map or in the ranked table — and its decomposition card fills across every peril and every rung at once: the published class, the layer that drew it, that layer's vintage, and the unscorable perils named rather than scored.
- Bidirectional. Row → the map flies and opens the popup; map click → the row highlights and scrolls into view; a second click on either side releases.
- A band-change count needs a declared comparison — so the 200-year rung declares itself not comparable instead of printing a false number.
- A deep link round-trips peril, rung, band scope, selection and theme. The CSV export carries the peril, the rung, the map, its vintage and the provenance.
Built, driven and measured — 2026-08-20.
The ring gate — one ring array, three different answers
The state's 200-year outline is 2 features, 1,247 rings — 183 exterior and 1,064 holes. Esri does not guarantee that a hole follows its own exterior in the array.
| Reading | Assets inside |
|---|---|
| Union every ring as its own polygon | 45 |
| Parent each hole to the most recent exterior | 42 |
| Even-odd across all rings, orientation-agnostic | 41 ✓ |
Only the last matches the server feature-for-feature. The build gate caught it by consequence, not by inspection — it failed on exactly one asset out of 2,000, 106 m from the nearest edge, and refused to continue.
The on-prem constraint is a security finding
Querying the public hazard service would send each asset's coordinates outside the perimeter, one request at a time. Every seismic value is baked at build time from the staged grid instead.
Provenance is declared, never derived
Computing the source column by stripping _band silently printed "map behind the band: Very High" on the one peril whose whole point is that it has none. Three assertions now forbid it.
Reading the figures: the hazard mapping, the tract frame and the classifications are real, published and probed. The asset register is GENERATED (seed 20260816) — derived from published figures, never from published geometry, filtered so it cannot attach to a real feature, and labelled on every screen, in every popup and in every export row.
What this application will not do.
- A screening indicator, never a catastrophe model. No loss, no damage ratio, no premium, no probability of default, and no verdict about any property.
- No combined multi-peril score, at any rung. Not a limitation to be lifted later — the ladders share no rung and are not equally informative.
- An analytics layer, never a system of record. It coexists with whatever risk and GIS stack the institution runs; no output is styled as reviewed, approved or filed.
- Read-only, end to end. No write path anywhere; nothing in this app edits a feature.
- Refresh, not streaming. These layers republish on a publication cycle measured in months, so the app prints its vintage rather than implying freshness.
- Team-level views, not per-user entitlements. The perimeter and SSO are the access control.
- English only, LTR throughout. No language switcher, no Arabic surface, no RTL — by decision, recorded rather than rediscovered.
- California is where the data is, not where the buyer is. Porting is a re-sourcing exercise, not a re-configuration — the rungs themselves change.
Every one of these is written into the delivered application's own README. A tool that hides its edges costs you the project it cannot finish.
One register.
Your jurisdiction's own rungs.
Your asset register with a location, a value and a valuation date; the severity levels your regulator and your state actually publish; and an owner for the class breaks on any continuous surface. The ladders get re-sourced, and this workbench scores your portfolio instead of a generated one.
It runs where your data already is. On-prem behind the perimeter and SSO, keyless OSM-derived basemaps, every hazard value staged and baked inside the network — because sending an asset register out to be scored is a procurement gate, not a technical detail.