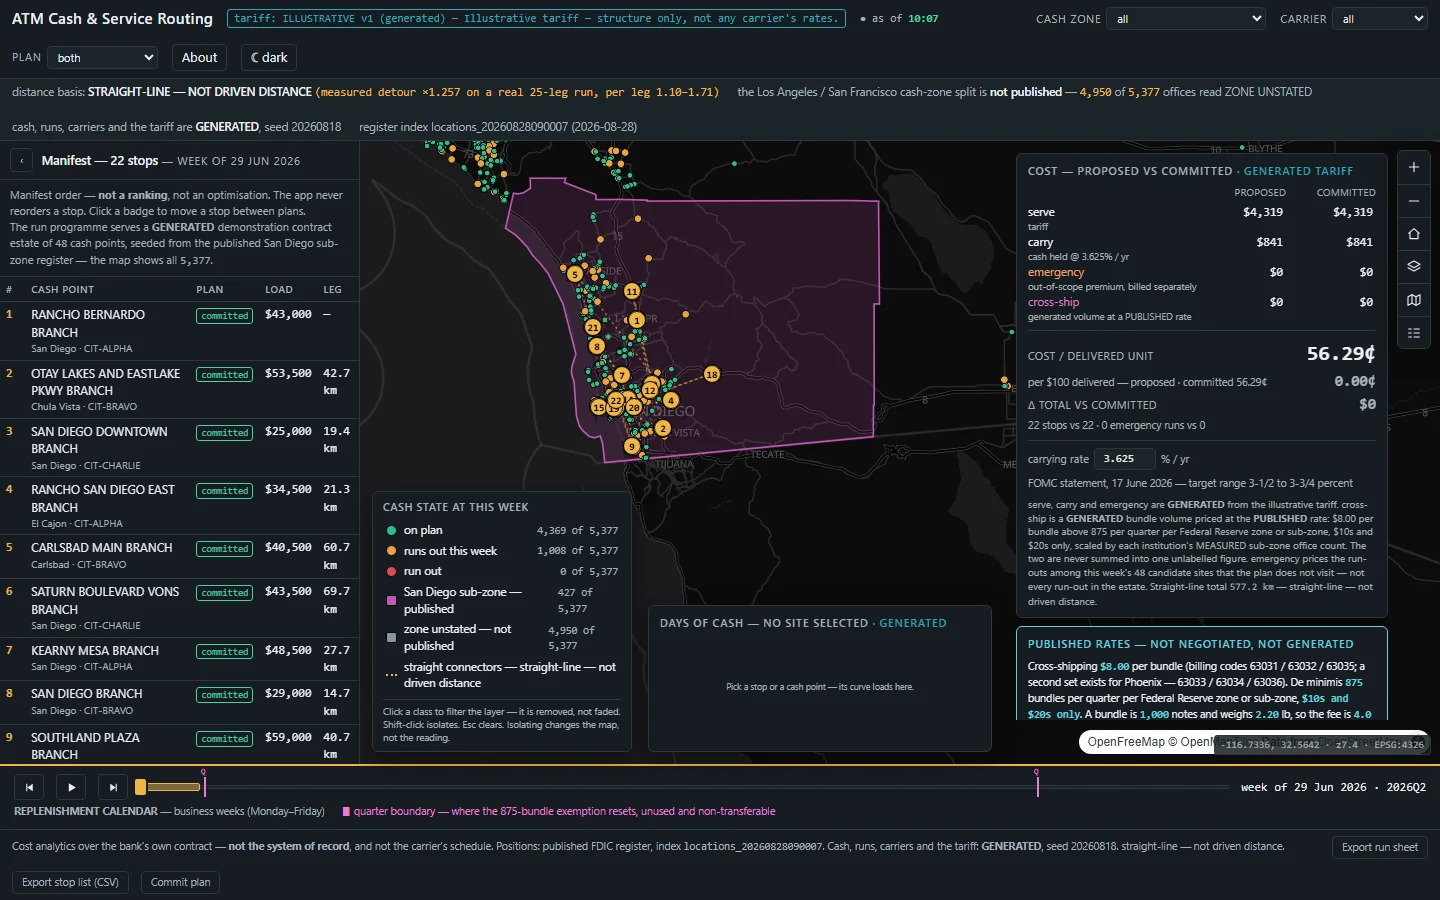
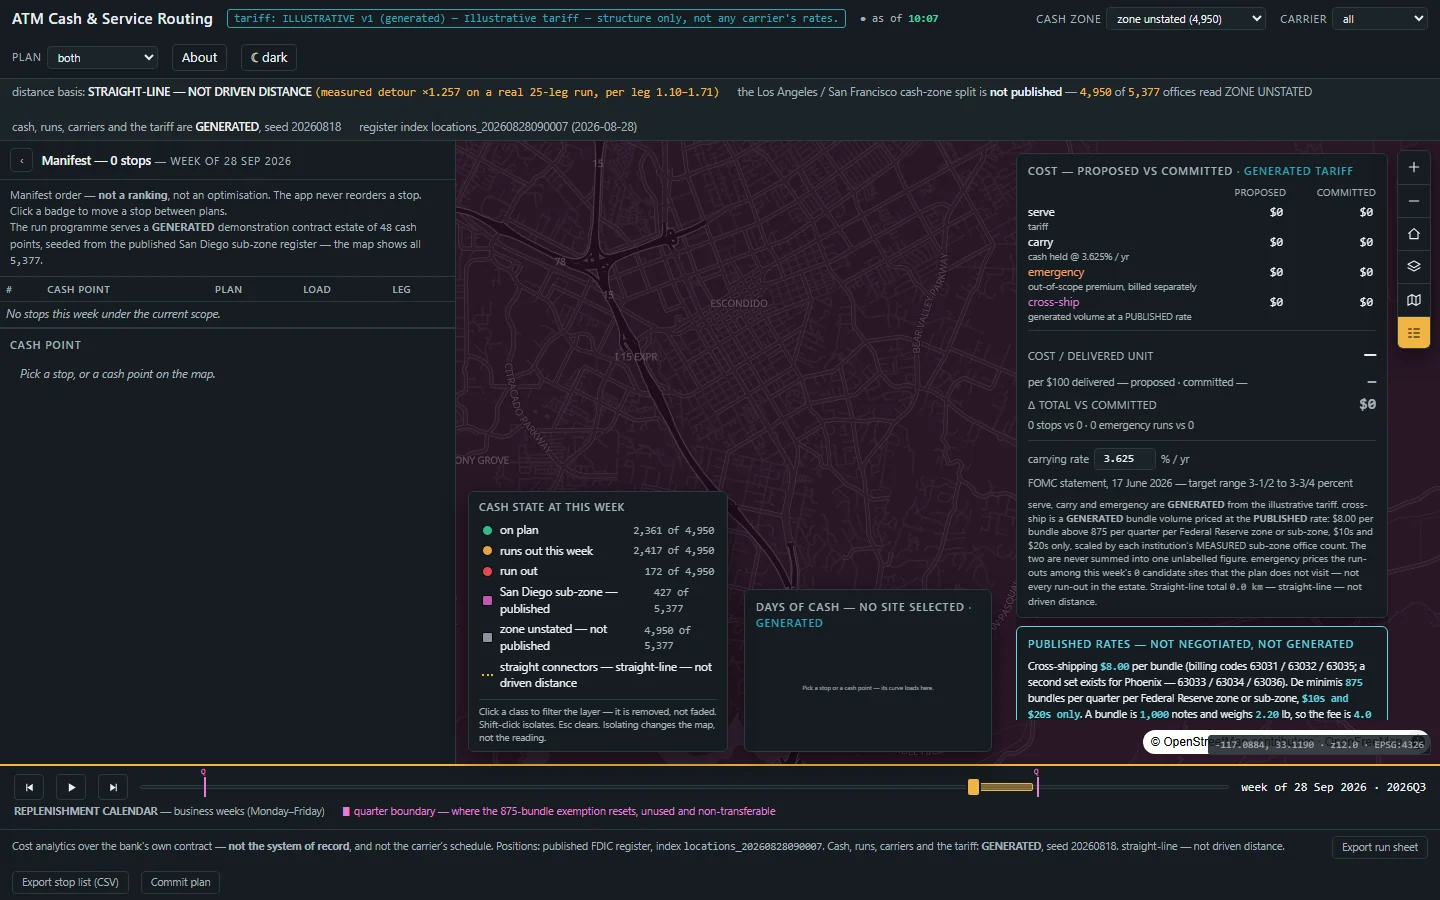
A cash run priced on the bank's own tariff, in four named terms, on a calendar that walks a business week at a time — beside the one cost boundary in this market that is drawn on a map and has a published price.
Not is today's run right — that is a different decision, taken by a different person against a different clock. This app is read at policy review and at contract renewal: monthly, quarterly, or the week before the cash-in-transit contract is re-let. Its output is an argument about money, not a morning's dispatch pack.
Which is why the manifest is a stop list in manifest order, never a league table, why nothing on screen is labelled optimal, and why the app never reorders a stop. It computes no route and uses no road network — a public router would transmit the customer's stop sequence, which is to say where cash will be and when, to a third party.
Nobody publishes where inside that band a given estate actually sits, because the answer is a function of one bank's contract and one bank's run programme.
The same source names what is not in the budget: "Everything else is either spread across other budgets, written off as one-off events, or never measured at all."
Asked which cash-management KPIs they use, 47% answered out of cash and only 32% answered costs. The base the industry's savings percentages are quoted against is, by the industry's own survey, unmeasured.
The source: ATM Total Cost of Ownership Guide, Networld Media Group — over 325 financial institutions, IADs and ATM providers across the US, Europe, Latin America, Africa and Asia Pacific. Dated 2017 and quoted as the industry's own measurement of its own practice, not as current market share.
| Product | What it publishes, verbatim | What it does not do | Prices a plan not yet ordered? |
|---|---|---|---|
| Sesami — SES Cash Cycle Optimizer | "25% Proven Reduction Of CIT Costs" · "25% Reduction Of Typical Inventory Holding Costs" | no tariff, no cost per stop, no cost per delivered unit, no map | No |
| Morphis — Reverse Vendor Invoice™ | "constantly monitoring and comparing vendor activity to the underlying contract" | checks the bill that arrived; no per-stop or per-delivered-unit price, no map | No — it looks backward |
| Diebold Nixdorf · Auriga · NCR Atleos · CMS | "a minimum savings of 15%" · "10 to 25%" · "over 200 user-adjustable variables" · "25-30%" | a percentage off a total, on the vendor's own claim; no rate card, no map | No |
| Cash Management.iQ | "view cash points on a map with status updates" | the only map in the set — and it is a status map, not a cost map | No |
| NamSys Cirreon · G+D · MorphisACM | GPS trucks, stop reordering from the depot, carrier margin | the other side of the invoice — the carrier's product | No |
| This app | a currency figure per delivered unit with the tariff terms visible behind it | does not forecast cash, does not reconcile an invoice, does not dispatch | Yes — that is the whole product |
A percentage cannot be checked; a rate card can. And the one published instance of the method working credits 14% off CIT cost to a bank's own analysis of trips-per-ATM against stock balance — no vendor product named.
The tariff cost of the run: per stop, per bag, per hour of crew time at the stop, per transaction, basis points of value carried — with the minimum charge, the contract discount and the surcharge applied in that order.
The cost of the cash the run leaves in the machine, for the days it sits there, at a rate the reader states and can change. This is the term whose absence recommends always fewer, larger runs.
The out-of-scope premium as its own billed line, because that is how it appears on a real invoice — separately itemised beside the routine armoured-carrier fee, never blended into it.
A generated bundle volume at a published Federal Reserve rate. The two are never summed into one unlabelled figure, and the line says on itself which half is which.
The carrying rate is a named, dated, on-screen, editable input — 3.625 % / yr, captioned FOMC statement, 17 June 2026 — target range 3-1/2 to 3-3/4 percent. A nonsense value is refused rather than silently applied.
The habit it corrects is documented: a practitioner in the 2017 survey, "The cost of cash is close to 0 percent, so the fewer replenishments, the better." The habit outlived the rates. The app never hides the input that flips its own recommendation.
Cents per $100 of cash delivered, which is deliberately the same axis as basis points, so it sits directly beside the published cross-shipping figures of 4.0 bp on $20s and 8.0 bp on $10s. Both plans, four terms each, and the signed delta — on one card, from one tariff, at one moment.
The total and the unit price disagree, and that is the entire point. A planner reading the total buys the wrong policy. Every term is derived from the tariff table, so changing one rate moves every number on screen in one frame.
The Federal Reserve's currency recirculation policy charges $8.00 per bundle above a de minimis of 875 bundles per quarter, per Federal Reserve zone or sub-zone, in the $10 and $20 denominations only, when an institution deposits fit currency and orders the same denomination within the same Monday–Friday business week. "Any unused exemption expires at the end of the quarter and is not transferable."
Twelve sub-zones are designated, and one of them splits California: San Diego carries its own 875-bundle allowance, monitored separately from the rest of the state. It is public, priced, per-institution, and calendrical and geographic at once — and not one product in the market study surfaces it.
CARTO's raster CDN now composites "API KEY REQUIRED" across every tile while answering HTTP 200 with real map content. A guard asserting the basemap was keyless was green while the shipped map was branded end to end. The set moved to OpenFreeMap / Versatiles / OSM / OpenTopoMap — and the finding is a core one, inherited by every app built on this template.
The cross-shipping term came out $0.00 in all 18 weeks because the generated bundle volume was a flat per-institution draw. The fee is assessed on an institution's whole activity in the zone, so the volume now scales with its measured office count — and the reset became something you watch rather than something a caption claims.
It counted every run-out in the whole 5,377-office estate against a 24-stop plan — $203,490 against $6,039 of serve cost, drowning the other three terms by two orders of magnitude. It is now scoped to the week's candidate pool: the sites the planner is actually deciding over.
Reading the figures: the office estate (FDIC BankFind, index locations_20260828090007), the San Diego sub-zone polygon and the Federal Reserve rate card are measured and published. Cash levels, the 48-site contract estate, run manifests, carriers, the whole tariff and cross-shipping volumes are GENERATED (seed 20260818), stamped on every screen, in every popup and in every export — and never summed into a measured figure.
Every one of these is written into the delivered application's own README, and the market mismatch with it: this is a demonstrable build in a market whose data can be verified — California — not a delivery to a named account. The Fed cross-shipping rule has no Gulf analogue. What ports is the shape; what does not port is every number.
Your carrier rate card with its minimum charge, discounts and surcharges; your site list with cash levels and cadence; your emergency-callout history; and a carrying rate your treasury will stand behind. Two weeks, and this card prices your contract instead of a generated one.
Swappable by configuration, not by code: the estate, the tariff terms, the currency, and the zone geography wherever a central bank draws one. The four cost terms are a typology the app renders, not a list of US numbers it ships.