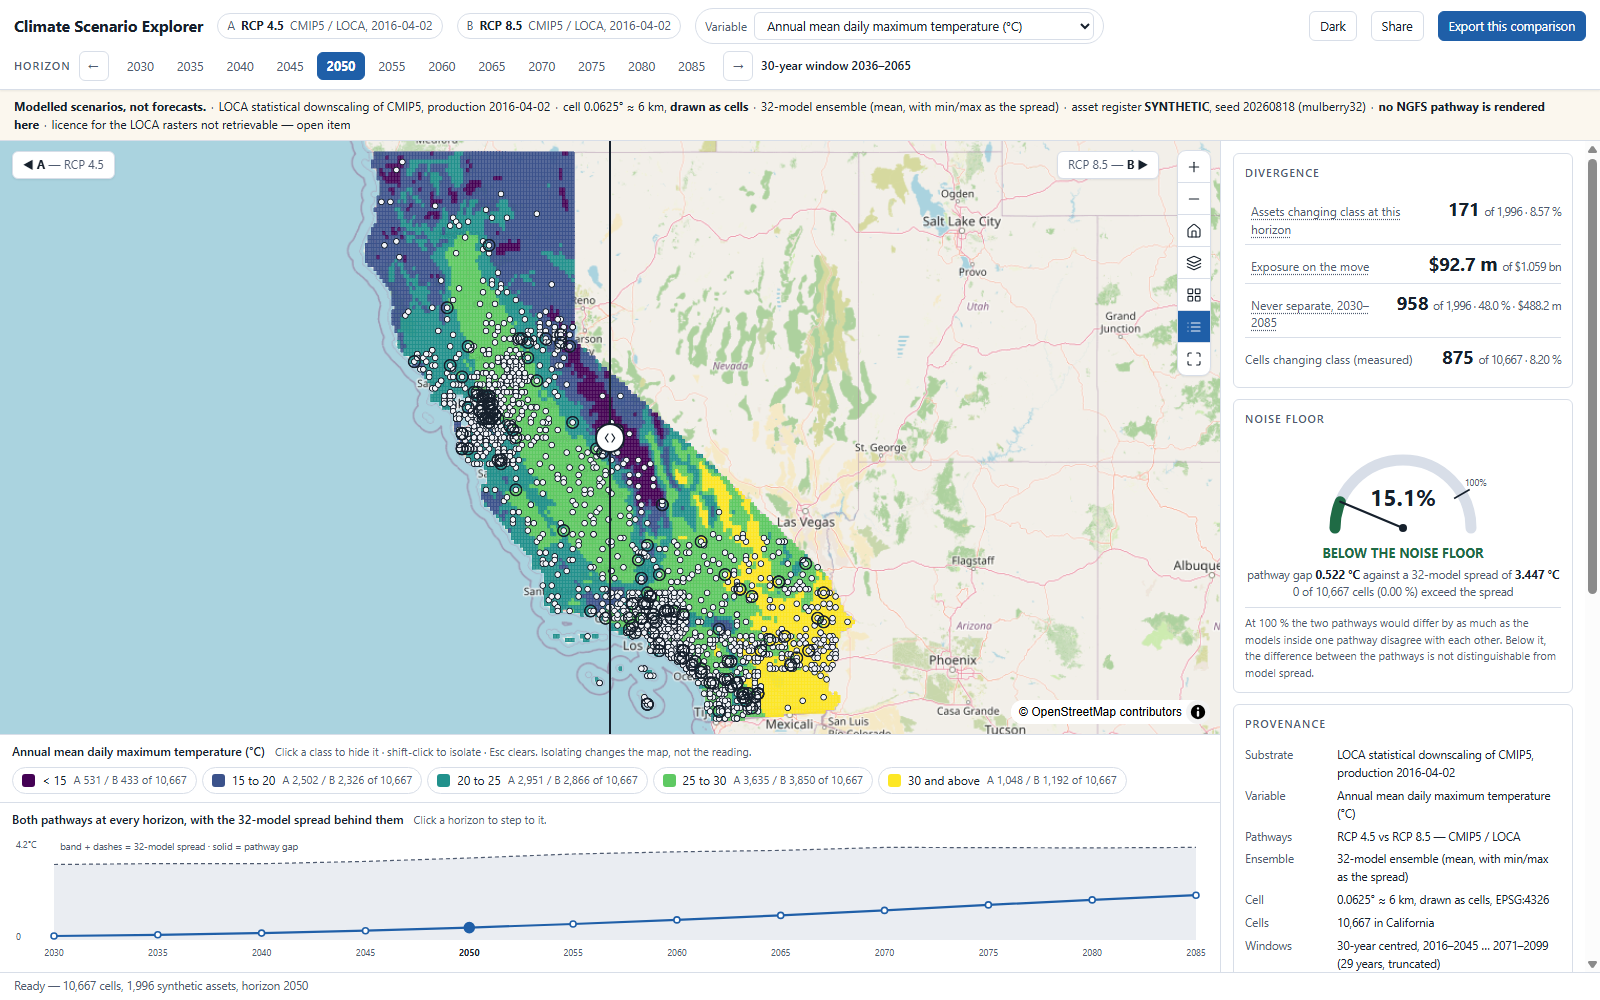
One geography drawn twice, a divider between the futures, and a fixed register of assets underneath both. Plus the number nobody else publishes: whether that disagreement is bigger than the disagreement between the models inside either pathway.
IFRS S2 ¶22(b) requires a preparer to disclose which scenarios were used, their sources, and the time horizons considered — and it deliberately does not prescribe those horizons. It requires only that the timeframes chosen reflect when climate-related risks are expected to become financially material.
That sentence is the product requirement. Choosing a horizon is a disclosure obligation, and nothing in the toolchain helps a preparer choose one on evidence. What leaves this app is an input — a defended horizon and a movement count with their provenance intact — not a filing, not a board pack, not a scored register.
The report records that participants noted the "limited differentiation between the scenarios over the 10-year horizon."
The physical module fixed every participant at a single year — 2050 — and stepped severity instead. The exercise could not have produced the year at which the pathways begin to separate, and no participant reports one.
Every anonymous path to the scenario data returns the same 1,847-byte SPA shell — a soft 404 served at HTTP 200. And the physical-risk basis of Phase V is retracted from Nature. A preparer told to disclose against NGFS needs to know that.
Of 935 published series: 305 RCP 4.5, 359 RCP 8.5, 231 historical — and no SSP at all. The CMIP6 downscaling exists, but as cloud object stores whose per-pathway ensembles are 33 / 62 / 34 model-members, a different model missing from each.
CMIP5 / LOCA at 0.0625° ≈ 6 km, RCP 4.5 against RCP 8.5 — served as cells, keyless, CORS-open, bulk-downloadable. The family is printed in the persistent notice, and the export reads "no NGFS pathway is rendered here" with its reason.
The published brief specified "NGFS Phase 5 scenario data + IPCC CMIP6 SSP layers." Neither half survived the probe. Stating that is part of the product — not a caveat appended to it.
| Free tool | What it draws | Compares two pathways side by side? | Holds your register? |
|---|---|---|---|
| NGFS Climate Impact Explorer | ISIMIP3b 0.5°, national and subnational, with model-agreement maps | Yes — a headline feature, across warming levels and emissions scenarios | No — California is one polygon |
| IPCC WGI AR6 Interactive Atlas | CMIP5, CMIP6 and CORDEX over reference regions | Yes — scenario and warming-level selection over maps | No — reference regions |
| Probable Futures | CORDEX-CORE downscaling, 10–50 km cells | Yes — a literal swipe divider between two model outputs | No |
| Cal-Adapt | California's own platform — the 3 km CMIP6 downscaling and its SSPs | Yes, at the scenario level | No portfolio in it |
| This build | The same cells, drawn as cells, with the bank's own assets on both sides | Yes — with one break set and one renderer object, or it is not a comparison | Yes — and it counts them |
Stepping horizons is not novel either — Jupiter steps 5-year increments to 2100, Munich Re publishes 2030 / 2040 / 2050 / 2100, Moody's answers at any year between 2020 and 2100. Offering every horizon is not the same as naming the one that matters for this book.
And every commercial product read is delivered as SaaS or an API. Using one means transmitting the asset register — where the assets are and what they are worth — outside the institution. That is the procurement gate, and it is why an in-perimeter comparison app is buyable at all.
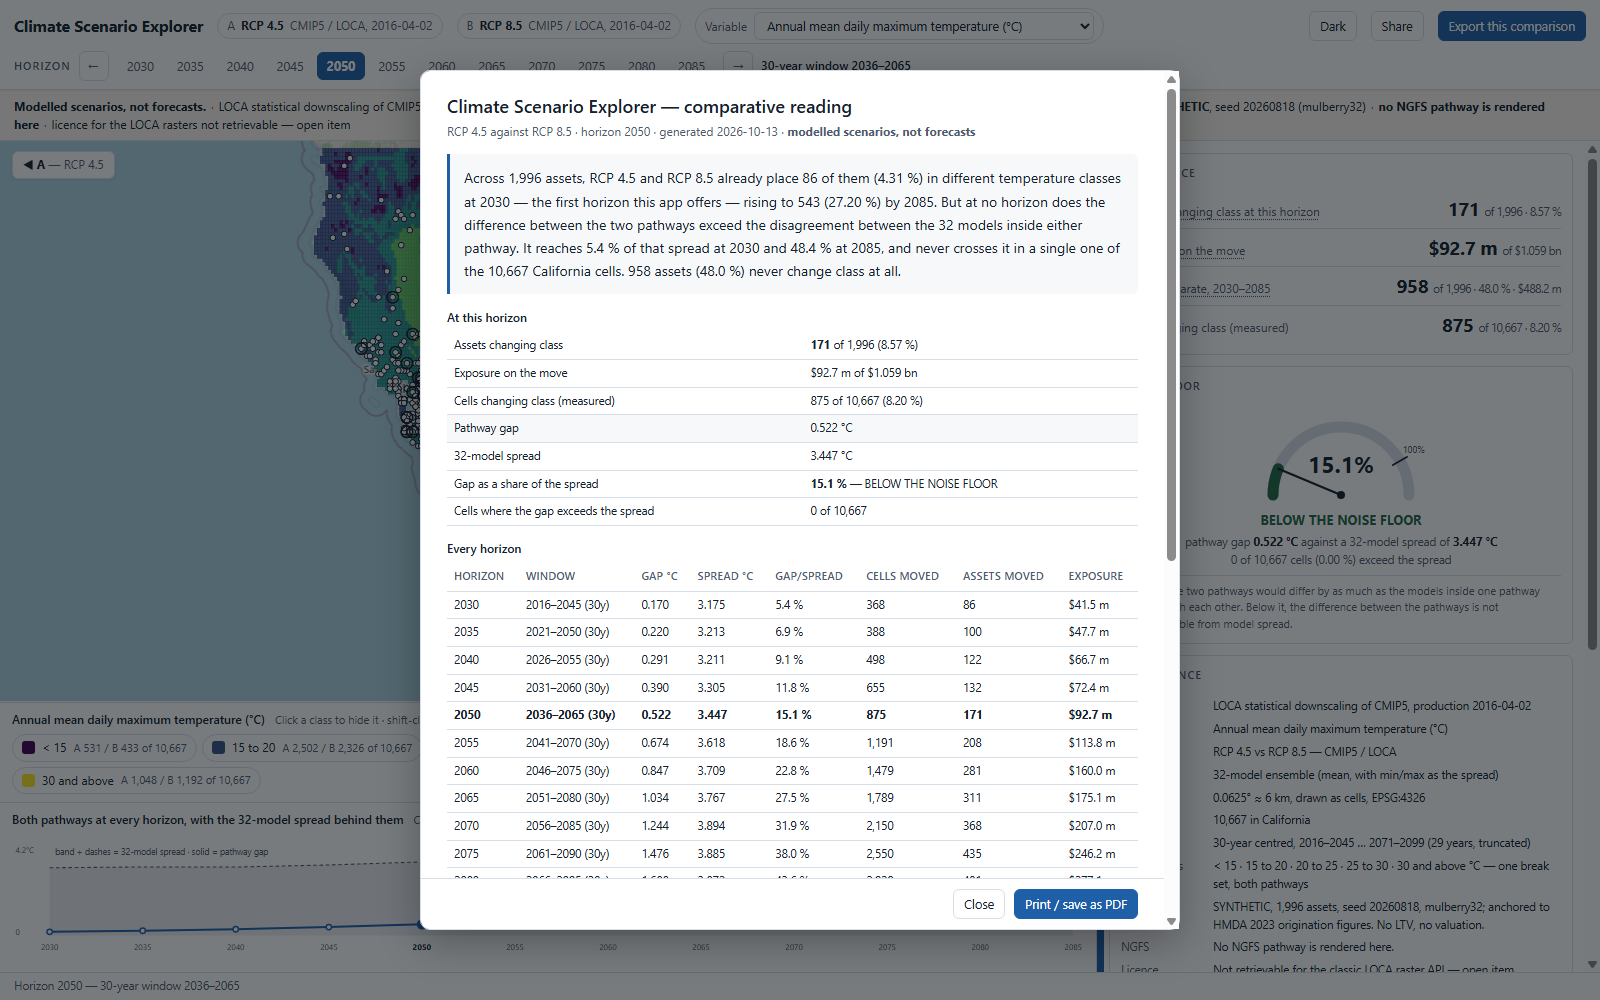
Two pathways disagree by some number of degrees. The 32 models inside a single pathway also disagree with each other. Divide the first by the second and you have the only quantity that turns a class-movement count into evidence — and nothing read in the market study publishes it.
A design that showed class movements without the spread would be reporting model disagreement as a scenario result. So the noise-floor gauge is the most important widget on the page, and the rail always prints the continuous gap in °C beside the count.
The loop in one sentence: the cells change under a fixed set of assets, and the rail names how many of them changed class — and whether that change is bigger than the models disagree with each other.
Read one annual raster per horizon and the divergence curve is not monotonic: at 2045 fewer cells differ (4.65 %) than at 2030 (7.00 %). That is interannual variability, not a climate. A horizon stepper built on single years reports that the pathways converge in the 2040s — which is false, and it looks exactly like a finding.
So the app steps 30-year centred climatological windows instead, and the same measurement rises monotonically at every step. The window is printed beside the horizon, always.
A second sensitivity, stated on screen rather than smoothed. The movement count is break-sensitive and can fall while the gap rises: on extreme-heat days the gap climbs monotonically from 1.57 to 25.13 days a year while the moved-cell count runs 30.55 % → 24.97 % → 24.63 % → 31.44 %, because both pathways can cross a shared break together. The rail therefore always prints the continuous gap beside the count, and the legend always prints the break set. A movement count without its breaks is not a reproducible number.
| Horizon | Window | Gap °C | Spread °C | Gap / spread | Cells moved |
|---|---|---|---|---|---|
| 2030 | 2016–2045 | 0.170 | 3.175 | 5.4 % | 368 |
| 2035 | 2021–2050 | 0.220 | 3.213 | 6.9 % | 388 |
| 2040 | 2026–2055 | 0.291 | 3.211 | 9.1 % | 498 |
| 2045 | 2031–2060 | 0.390 | 3.305 | 11.8 % | 655 |
| 2050 | 2036–2065 | 0.522 | 3.447 | 15.1 % | 875 |
| 2055 | 2041–2070 | 0.674 | 3.618 | 18.6 % | 1,191 |
| 2060 | 2046–2075 | 0.847 | 3.709 | 22.8 % | 1,479 |
| 2065 | 2051–2080 | 1.034 | 3.767 | 27.5 % | 1,789 |
| 2070 | 2056–2085 | 1.244 | 3.894 | 31.9 % | 2,150 |
| 2075 | 2061–2090 | 1.476 | 3.885 | 38.0 % | 2,550 |
| 2080 | 2066–2095 | 1.688 | 3.872 | 43.6 % | 2,929 |
| 2085 | 2071–2099 | 1.884 | 3.893 | 48.4 % | 3,299 |
10,667 California cells · tasmax · 32-model ensemble. The last window is truncated to 29 years — the published series ends 2099, and the app says so on screen and in the export.
The CRO does not act on asset #1,412 changing band. They act on 171 assets change class at 2050, carrying $92.7 m of $1.059 bn — and the pathway gap is 15.1 % of the model spread. Per-asset detail exists to make the count auditable, never to issue a verdict.
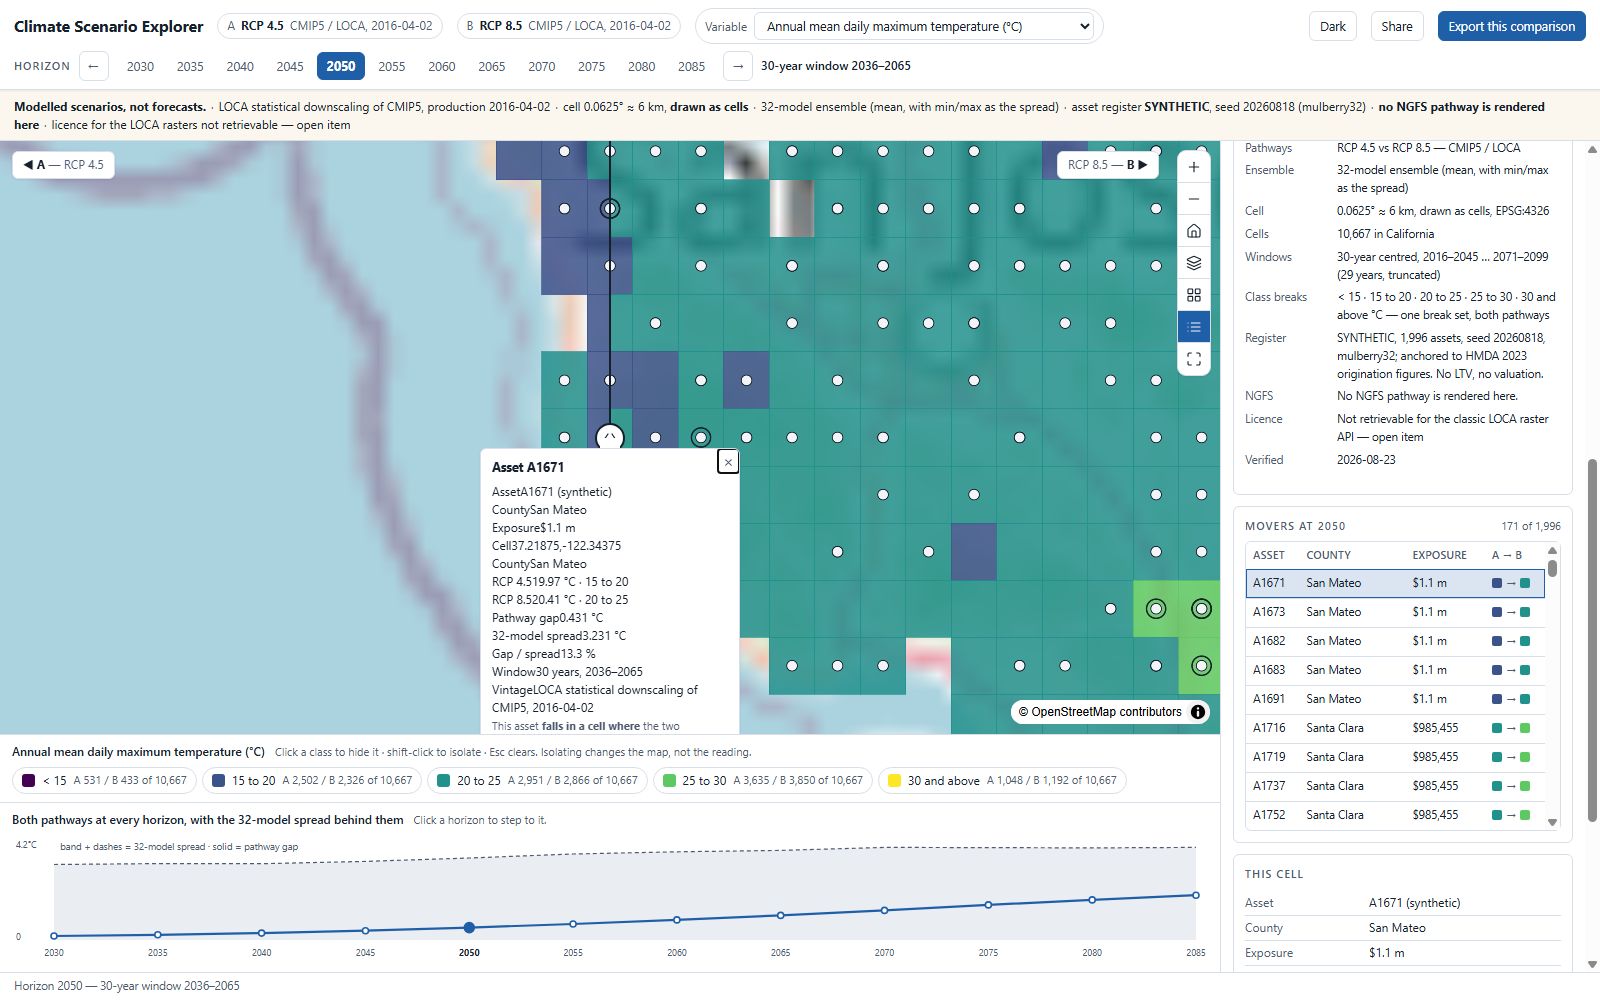
The offline suite re-runs the register generator from the cached anchor and asserts it reproduces the shipped file — 0 differing of 1,996. The algorithm (mulberry32) is named in the notice bar, the provenance strip and every export, because a seed without its generator is not reproducible.
The pathway-B label sat under the zoom cluster; two drawer spans ran together as "CARTO Positronlight"; the resize grip scrolled away with the rail's content. Every non-visual suite was green through all three. Each now carries a geometry assertion so it cannot regress.
Under a ~500 KB/s link the driver samples every loading frame and asserts the bar carried its lasting statements throughout — not forecasts, register SYNTHETIC, no NGFS pathway is rendered. A progress message may never displace a caveat.
Reading the figures: the scenario substrate, the reporting geography and the HMDA anchor are real, published and probed. The asset register is SYNTHETIC (seed 20260818, mulberry32) — 1,996 positions across California's 58 counties in proportion to published 2023 origination counts, carrying no LTV and no valuation — and labelled as such on every screen, in every popup and in every export. The counties sum to 99.54 % of the published statewide count; the residual is recorded, not hidden.
Every one of these is written into the delivered application's own README. And SB 261 — the statute that names TCFD and IFRS S2 — is enjoined as of 18 November 2025, with CARB not enforcing the 1 January 2026 date. The statute stands; enforcement is paused. Both halves are true, and a deck that states only one of them is wrong on some date.
Your asset register with coordinates and exposure, the pathway pair your disclosure names, and the horizons your strategy actually runs to. The comparison then reads your book instead of a generated one — inside your perimeter, with nothing transmitted out.
Swappable by configuration: the variable, the break set, the horizon axis, the climatological window and the reporting geography. Not swappable by configuration: the substrate — a different jurisdiction is a re-sourcing exercise, and the app will print the coarser cell rather than imply a precision it does not have.