How much of the book sits
where no map has looked?
Every physical-risk product answers how bad is it here — and answers it everywhere, by substituting a model wherever the published map is silent. This one reports the silence itself, as a number, with a denominator.
Which segments to reprice, limit, or disclose as exposed.
And — in the same breath — which segments you must tell your supervisor you cannot yet answer for. That second half is the product.
A credit committee can act on "12 % of the book is in a mapped flood zone." It cannot act on "88 % is not" — because that 88 % is three different things wearing one label.
IFRS S2 ¶29(c) asks for the amount and percentage of assets vulnerable to climate-related physical risks. "Percentage" forces a denominator, and a denominator is only honest if the assets no map covers are counted somewhere.
A supervisor's second question is never what is your exposure.
It is what is your coverage.
ECB Banking Supervision, 2022 thematic review on climate-related and environmental risk.
"Not in the flood zone" is not one answer. It is three.
Collapsing the second and the third is the failure this application exists to fix. Colouring absence as safety is the same mistake as colouring it as danger — which is why not spoken to is ochre, and never red.
California publishes its own silence. Nobody is counting it.
A polygon around what was never looked at
The California Geological Survey serves Unevaluated Areas — 2,806 quadrangles it has published to say it has not evaluated them for liquefaction. A live feature service. It is 3.8× larger than the hazard zone layer beside it.
A zone code that means we do not know
FEMA's Zone D is defined as areas of "possible but undetermined flood hazards, as no analysis of flood hazards has been conducted." It is mapped, and it sorts into "not A/AE/V" in every simple WHERE clause ever written.
A federal index that drops perils quietly
FEMA's National Risk Index computes a tract's composite over a varying number of perils, and does not show the count. Where a hazard has no data, its expected annual loss is simply not included in the summation.
A hazard map with no probability at all
Flood publishes 1 % and 0.2 %. Seismic ground motion publishes 475-year and 2,475-year. Wildfire publishes no return period whatsoever. One severity control across the three would fabricate the wildfire series.
The regulator has already drawn the boundary of its own ignorance and published it as geometry. The arithmetic is available; it is simply not being done.
More than half of California's building value sits where the state has not looked.
| Peril, on the published convention | In a mapped zone | Analysed, found low | Not spoken to |
|---|---|---|---|
| Earthquake — liquefactionCGS Zones of Required Investigation | 15.9 %$1.235 tn | 29.1 %$2.255 tn | 54.9 %$4.254 tn in CGS Unevaluated Areas |
| Wildfire — FHSZCAL FIRE, SRA 2023 ∪ LRA 2025 | 18.3 %$1.417 tn | 78.7 %$6.096 tn | 3.0 %$231 bn outside both surfaces |
| Flood — NFHL-schema panelsCal OES · CA GIO | 5.0 %$384 bn | 14.6 %$1.131 tn | 10.4 %exact: $620 bn Zone D + $184 bn no DFIRM + a bounded 70.0 % with no published polygon |
| At least one of the three unanswered5,392 of 9,129 tract points | all three unanswered: 1.4 % · $107 bn | 61.9 %$4.790 tn of published building value | |
Every California census-tract interior point — 9,129 of them — classified by exact point-in-polygon against each published layer, then weighted by FEMA's own published building-exposure value ($7.744 tn). Not a sample, not a model, and not a land-area share: a value share.
Wildfire is the counter-example, and the design carries it. Only 3.0 % of value falls outside both FHSZ surfaces — California's wildfire mapping is nearly complete by value. A design that assumed "unmapped" is always the big number would have been wrong about one of its own three perils. Wildfire's silence is in the vintage and in the federal index, not in the state's coverage.
Every one of them fills the silence. None of them counts it.
| What the category sells | The coverage claim it headlines | Where it stops for this question |
|---|---|---|
| Physical-risk analytics for portfolios | "2bn+ assets", "11 hazards", building-level, 30 m wildfire | Coverage asserted as a headline; the complement is never named. Its own IFRS S2 page makes no statement about coverage gaps. |
| Global catastrophe modelling | "the first truly global" flood model; 30 m maps; any scenario to 2100 | The purest form of the pattern: where the regulator's map is silent, the product is a model that fills the silence. |
| Address-level peril scores | "50+ peril risk scores, 1 API call" | A score is always returned. An always-returnable score is structurally incapable of expressing no map here. |
| Property intelligence in the loan file | property data on "99.9 % of properties" | A property-record claim, not a hazard-map claim — the two are routinely conflated. |
The gap is already proven — by the market
A national flood model finds ~14.6 M US properties at substantial risk against FEMA's ~8.7 M — roughly 68 % more — and names "areas FEMA has not mapped" among its reasons. It then does what all of them do: replaces the official map rather than reporting the difference.
And substitution is not free
GARP's 2026 benchmarking put thirteen vendors against the same assets: they "largely disagreed on which hazard ranked as the primary hazard," and on infrastructure sites disagreed on whether flood risk existed at all. A number from a published map with a published date can be argued about. A number from a proprietary model can only be believed.
Both answers are defensible. Only one of them produces a figure a supervisor can audit against a published map.
The coverage board.
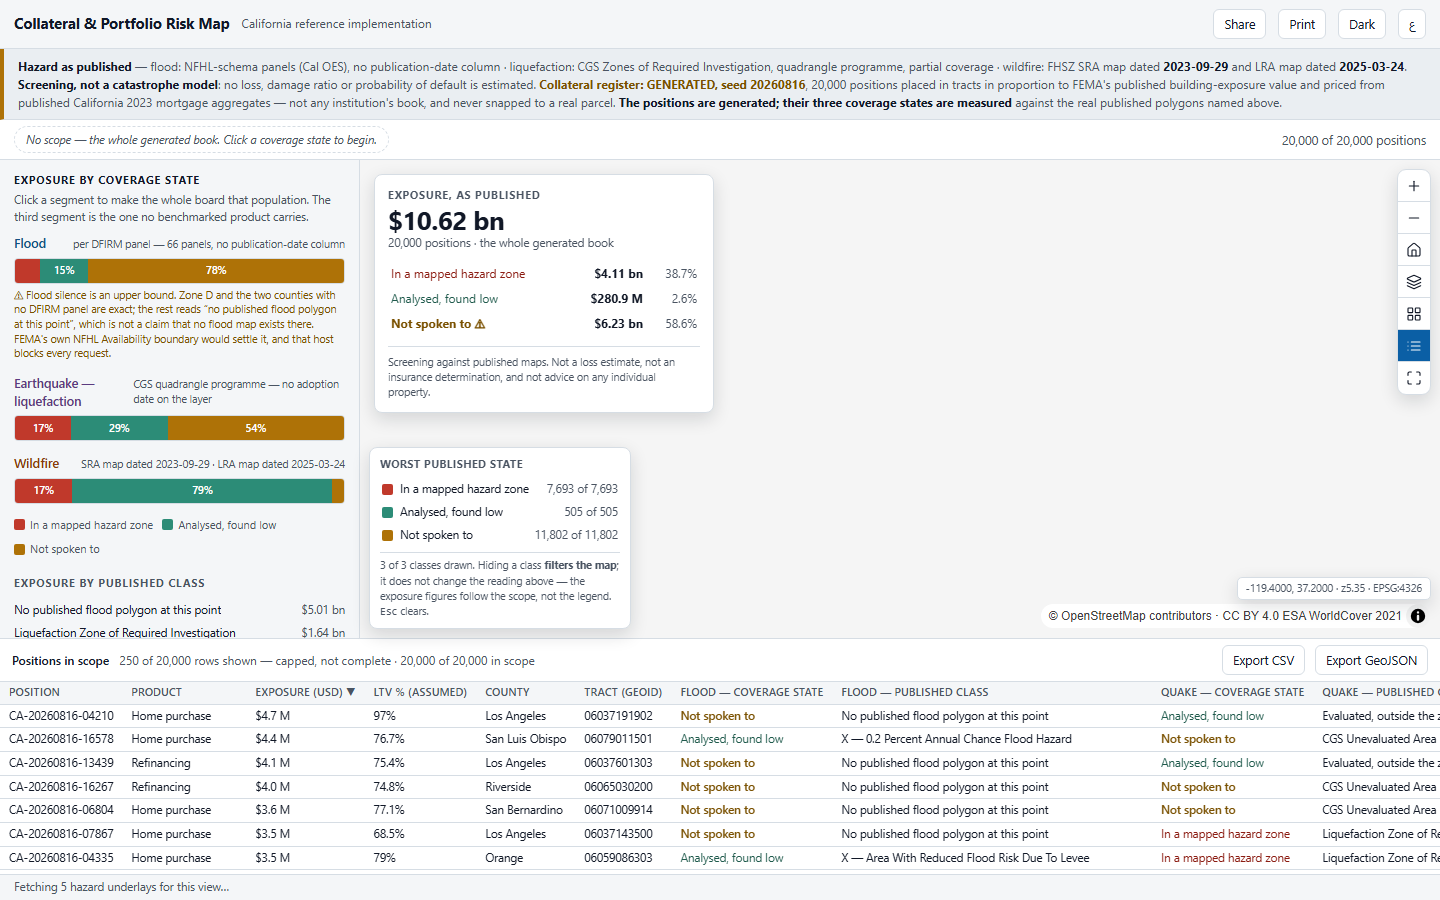
- The rail leads; the map serves it. The chart nobody else ships — exposure by coverage state — sits at the top of the rail and at the top of the map.
- A persistent notice bar. Every hazard vintage verbatim, screening not modelling, and the generated register with its seed. Never the status line, which is transient.
- Three states, three ways. A colour and a word and a position in the bar — so the reading survives a greyscale print.
- Every cap keeps its denominator. 250 of 20,000 rows shown — capped, not complete. A silent top-N reads as "this is everything".
- The flood bound is on screen, beside the figure it qualifies — not in a method note.
A triple, with a denominator.
Every benchmarked product reports value inside the zone. This one reports three figures that sum to the book, and every term traces to a named published layer with a printed vintage.
in a mapped hazard zone $4.11 bn = 38.7 %
analysed, found low $280.9 M = 2.6 %
not spoken to $6.23 bn = 58.6 % ⚠
The headline is the third bar — and the decomposition beneath it is the part no product read here offers: which peril was silent, on which layer, at which vintage.
The three figures sum to the denominator exactly, at every scope. Change the scope and all three recompute from the source — they are one expression, not three cached numbers.
Click a coverage state. The whole board becomes that population.
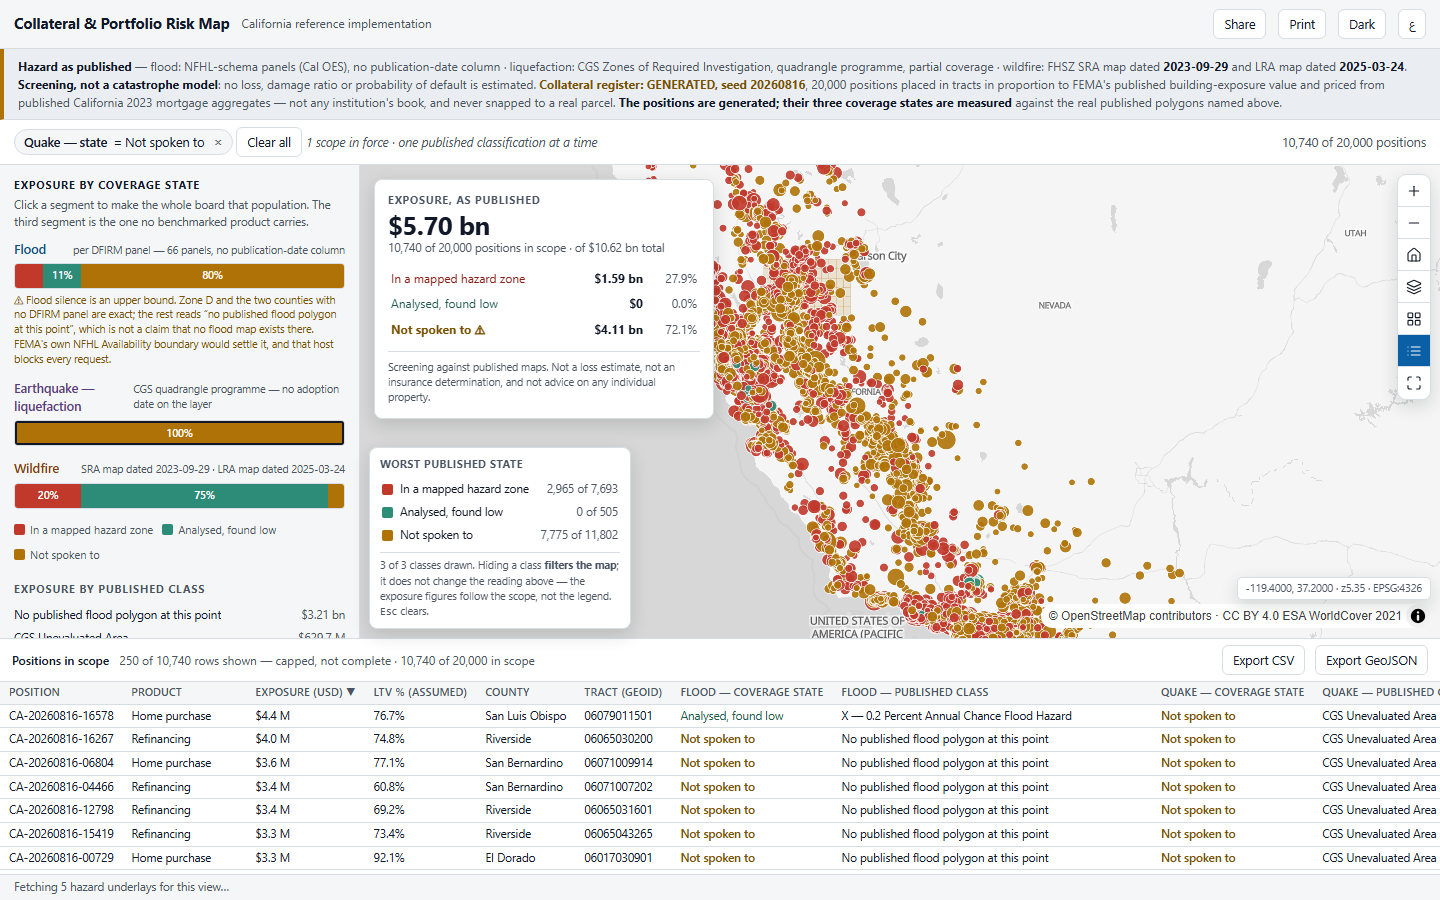
Read the second row. Scope the book to the ground California's seismic programme never evaluated, and analysed, found low goes to exactly zero. That is the whole argument in one number: none of this collateral has been cleared — it has been skipped.
Built, driven and measured — re-verified 2026-08-17.
Vintage moves more than modelling does
Three superseded CAL FIRE surfaces are still live and still public — and the one titled "FHSZ FOR REAL ESTATE INSPECTIONS" is the worst trap of the three. Measured in the research probe, the choice between vintages reclassifies $470.7 bn — 6.1 % of California's building value — more than any modelling choice this app could make. That is why the vintage lives in the notice bar and in every export.
Two published authorities, opposite answers
FEMA's National Risk Index returns 'No Rating' for wildfire on 3,984 of 9,106 California tracts — $2.628 tn, 33.9 % of building value — with zero Not Applicable and zero Insufficient Data rows. On 77 of those tracts ($38.7 bn) CAL FIRE publishes High or Very High. So NRI is a separate, labelled lane, never blended into the class.
The traps are asserted as present
The OID that is OBJECTID_1 with a decoy OBJECTID beside it · the peril prefix that is IFLD where every data dictionary says RFLD · a fourth wildfire class the sibling surface does not have · a service URL misspelled where the intuitive one 404s. Asserted live, so the day a service fixes itself we find out.
Reading the figures: the hazard layers, the coverage measurement and the reporting geography are real, published and re-probed. The collateral register is GENERATED (seed 20260816) — 20,000 positions priced from published California 2023 mortgage aggregates, placed inside tracts in proportion to published building value, never snapped to a parcel — and labelled as such on every screen, in every popup and in every export. No generated number is mixed into a measured one.
What this application will not do.
- It does not estimate loss. No damage ratio, no probability of default, no verdict on any individual property. Screening, not modelling — said persistently on screen and in every export.
- It ships no return-period control. Not a stepper, not a slider, in any form. The three perils publish on ladders no arithmetic reconciles, and wildfire publishes none at all.
- It is present tense, exclusively. No scenario, no horizon, no projected surface. It renders the hazard map published today.
- It has no address search. Selecting a position scopes and explains the population; it never renders a judgement on a property, and the popup says so.
- It ranks nothing. No rank numerals, no utilisation bars, no appetite line — that is a different product in this same category.
- On-prem, behind the perimeter. No keyed provider and no external call it cannot make from inside a bank's network. Every bound layer has a recorded bulk path.
- Read-only, end to end. No write path, no editing. Freshness is refresh, not streaming — which costs nothing on a publication cycle measured in months.
- Public data is never synthesized. California publishes no standalone landslide zone, so that lane renders empty with its citation — not filled from the susceptibility raster sitting beside it.
Every one of these is written into the delivered application's own README. A tool that hides its edges costs you the project it cannot finish.
Your collateral.
Your regulator's maps.
One extract of the collateral register with coordinates, and the published hazard layers your own supervisor recognises. The join runs at build time, so every reader of the pack sees the same figures.
California is where the data is verifiable, not where the buyer is. What transfers to another market is the three-state model, the vintage discipline and the uncovered-exposure denominator — none of which depend on FEMA. What does not transfer is a single layer, field name or zone code, and a demo that implied otherwise would be a lie the first technical question would find.