Is this a hotspot —
or just where the people are?
An alert queue that is the protagonist, a map that serves it as evidence, and a rate card in place of a count KPI — so no number on screen ever appears without the denominator it was divided by, or the test that decided it.
Which alert do I work next.
Escalate it, close it, or open a case. That decision is made dozens of times a shift by one analyst at a queue, and the same evidence is re-read at period end by the person who has to stand behind the monitoring programme.
Which is why the map is evidence for the queue, never the product — and why the KPI slot holds a rate: a numerator, its denominator and the test, rendered as one indivisible object. A count map of anything is a population map with a crime label. Put one beside a work queue and the queue inherits the error.
ZCTA 95014 holds 48 of the window's 5,022 alerts against 241,211 transactions — 0.199 per 1,000 against a book rate of 0.234. Not distinguishable from the book, in either direction.
On a count map it is a red blob near the top of the state. It is the busiest cell that is not a finding, and the app says so in a word.
The regulator draws the map twice, because once is misleading.
The published maps are count maps
FinCEN's check-fraud trend analysis — 15,417 BSA reports, more than $688 m — carries two maps of the same data in one appendix: subjects by count, and subjects per 100,000 residents.
The two top-fives share one state
California is second in the country by count and absent from the per-100,000 list entirely. FinCEN says the quiet part in its own prose: "populous states with large urban areas have reported more incidents."
The commercial side does not correct it
County heat maps of compromised merchants: counts, no denominator, a decade stale. Card-skimming league tables: a top-ten list of the ten largest states. A population map with a fraud label.
The published brief for this app promised "transaction and incident hotspots." Correcting that one word did not invalidate the solution — it is the solution.
Same reports. Same states. One state in common.
| Rank | By count of BSA report subjects | Per 100,000 residents | What the count column is measuring |
|---|---|---|---|
| 1 | New York — 1,702 | Alabama — 13.992 | population |
| 2 | California — 1,458 | Georgia — 10.838 | California is not on the right-hand list at all |
| 3 | Florida — 1,423 | Washington, D.C. — 9.572 | population |
| 4 | Georgia — 1,161 | New York — 8.425 | the one overlap |
| 5 | Texas — 1,007 | New Jersey — 7.579 | population |
| — | A bank has a better denominator than residents | its own transaction, account and terminal counts | this app's rate |
FinCEN normalises by residents for a good reason — it has no exposure figure across the industry. A bank has one. Normalising by it is the only version of this map that describes the bank's own book rather than the census.
The method itself is fourteen years old and published in the AML trade press: separate filings "by state, county, zip code and branch" and find the branch with a disproportionate ratio of filings to customers. Nobody has put it on a map, given it a significance test, or wired it to the queue an analyst actually works.
The method travels on the artefact.
Nothing read for the study — the FFIEC manual included — sets a cell size, a method or a significance threshold for AML. That is a finding, not a gap to fill later. The app cannot claim conformity to a convention that does not exist, so it states its own where a model validator can reproduce it: on screen, in the CSV header, and in the printed case pack.
- Two families, tested separately. One-sided binomial exceedance and one-sided deficit against the book rate — never one two-tailed number standing in for both questions.
- Benjamini–Hochberg within each family. 1,802 cells at α = 0.05 uncorrected returns roughly 90 false findings. Here that is not a rounding error, it is the whole error.
- A stated exposure floor. Below it a cell reads too little exposure to test — never at the book, which would assert an absence of evidence as evidence of absence.
- Gi* is second, and labelled second. A rate-based Getis-Ord over queen-contiguity neighbours answers a different question — is this neighbourhood high, not just this cell. It is never the fill.
escalation 14 % · 64 alert(s) carried with no resolved cell
exposure floor 12,843 tx · 519 of 1,802 cells testable
Benjamini–Hochberg q < 0.05 within each family
cell vintage 2020 ZCTA · extract 2026-08-23 14:20 · seed 20260818
A cell is in exactly one of five states — and two of them are refusals.
Four in ten cells are purple on first paint
746 of California's 1,802 ZCTAs contain no bank office at all. A monitoring programme keyed to branch of account is blind to two-fifths of the state, and the app says so on the first screen. Dropping those cells would show a tidy map of the half it can see and imply the other half is quiet.
One purple idea, two forms
Purple fill where there is no exposure at all; purple outline where there is too little of it. Neither is ever green, and neither is ever absent. Every state carries a colour and a glyph and a word, so the reading survives a greyscale print — and no fill ever carries text.
Data colours are the same hex in light and dark — a verdict that changed colour with the theme would make two screenshots of one reading disagree, and the suite asserts that no verdict token is redefined in the dark block. On the 24-hour window no California cell reaches the floor: every cell reads too little exposure to test, the map declines a verdict, and the queue still works. That is the honest answer, not a defect.
The queue is the protagonist. The map is its evidence.
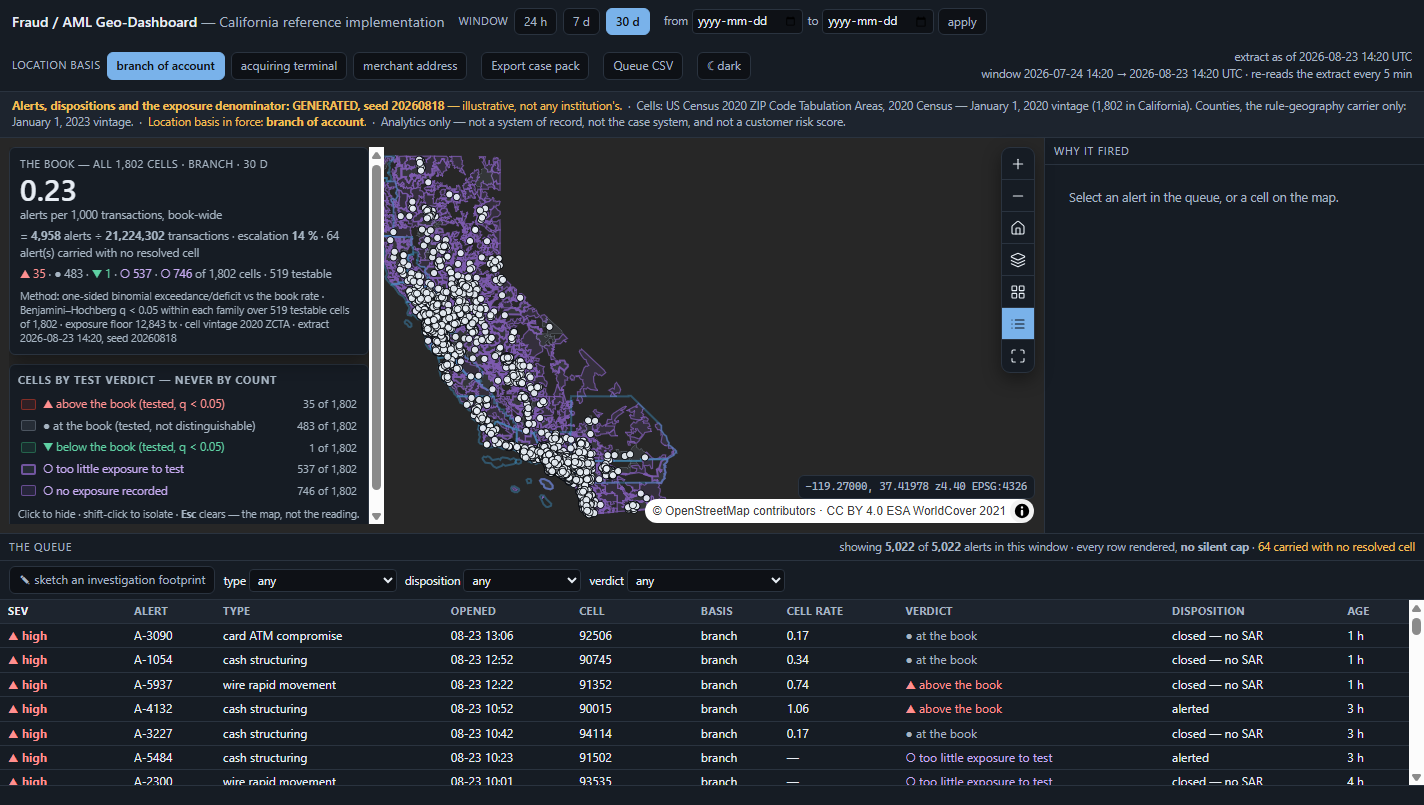
- A rate card, not a count KPI. Numerator, denominator and test as one object that cannot be quoted in halves.
- A persistent notice bar. What is generated, the seed, the cell vintage, the basis in force, the analytics-only scope — never the status line, which is transient.
- The legend filters, and counts. Click hides a class, shift-click isolates, Esc clears — a real filter on the cells layer, never a fade. It changes what is shown, not the reading.
- The location basis is a population, not a filter. Switching it re-derives every cell, every denominator, every test and the book rate itself. There is no "all bases" option and there never will be.
- Unresolved alerts are carried. The 64 with no resolved cell are counted separately — never dropped, never assigned to a neighbour.
- Every row rendered — 5,022 of 5,022 in the window, no silent cap.
The rate, beside the escalation rate.
Neither half alone is new. The first is the honest version of what everyone draws. The second is the one nobody has — and it is what turns a picture into a decision, because it separates a geography that is risky from rules that are merely noisy in it.
38 alerts ÷ 51,151 transactions = 0.74 per 1,000, against a book of 0.23
▲ ABOVE THE BOOK — exceedance q < 0.0001, Benjamini–Hochberg over 519 testable cells
neighbourhood Gi* z = +5.34 (a second reading, never the fill)
escalation in this cell 34 % · book-wide 14 %
→ a REAL CONCENTRATION: work the queue here.
Two ratios, both printed, never conflated. Change the window or the basis and the rate, the test, the verdict, the book rate, the legend counts and the queue order all move in one frame — because they are one derivation, not five.
Counts from the shipped reading. More of the statistically hot cells are tuning artefacts than are real concentrations — 17 against 13. Cell 90006 holds the state's second-highest alert count and fires at three times the book rate at q < 0.0001, yet escalates at 7.9 % against 14 % book-wide. On any hotspot map ever shipped it is the reddest thing on screen. Here it is a rules problem, and the app names it as one.
Bidirectional — and it refuses out loud.
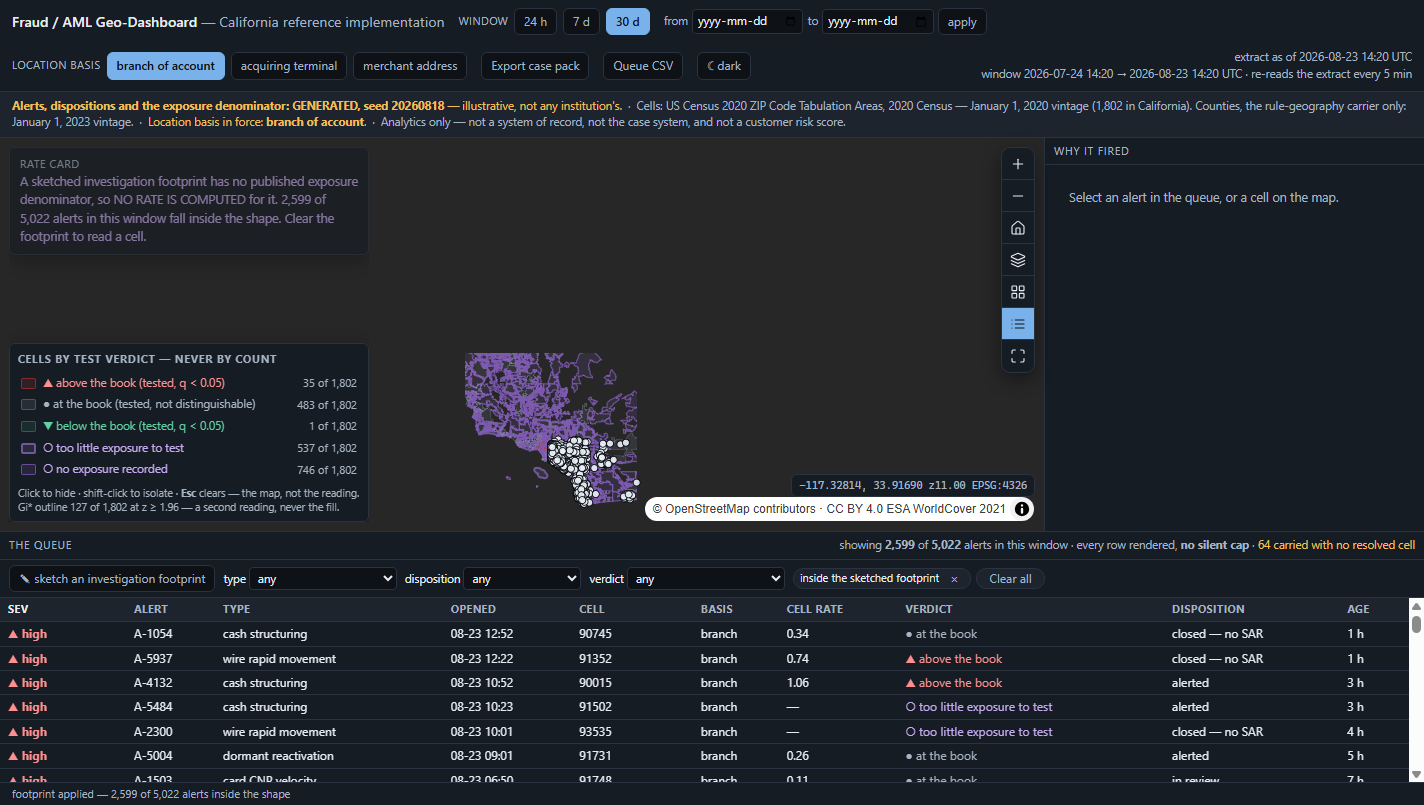
A sketched footprint gets no rate
It scopes the queue by point-in-polygon across cells — 2,599 of 5,022 alerts here. But a shape the user drew has no published exposure denominator, so the card greys out and says why. It does not divide by something plausible.
A no-exposure cell gets no method block
A method describes a test, and no test was run there. Printing one beside the refusal implies a reading that does not exist. The too little exposure state keeps its method — the floor that refused it is part of the method.
The merchant lane ships empty
No public register of merchant locations exists. The map renders no cells, the queue no rows, and the notice states the reason. A lane that quietly showed data would have synthesized public geography.
Three published rule layers — and two of them are not in force.
| Layer | Footprint in California | Window | Status, as shipped |
|---|---|---|---|
| HIFCA — High Intensity Financial Crime Areas | 21 of 58 counties | none published | DESIGNATED — no publication date, no version, no boundary file |
| Southwest Border MSB Geographic Targeting Order | 11 ZIP codes (Imperial 4 · San Diego 7) | 2026-03-07 → 2026-09-02 | IN FORCE nationally — SUSPENDED across this app's entire footprint |
| Residential Real Estate GTO county list | 5 counties | 180-day ceiling ⇒ 2026-04-08 | STATUS NOT ESTABLISHED — no renewal retrievable |
They scope; they never score
68.3 % of California's full-service bank offices sit inside a HIFCA county. An app that shades HIFCA red has shaded California. Scope the queue to HIFCA is a legitimate filter with a citation; rank this alert higher because it is in one is not, and the app cannot express it.
Rule geography expires
Every layer carries authority · citation · effective_from · effective_to · status, and the app refuses to draw one that is missing any of them. A lapsed layer dashes to 50 % and cannot scope the queue without a confirmation naming the date.
This is the feature
Every incumbent that draws a designated area draws it as though it were permanent. The whole value of a supervisor's boundary is that somebody wrote it down on a date — and that it can be taken away. Outline only, one blue, never filled, never in the verdict legend.
HIFCA's boundary is derived, not published. FinCEN publishes a table of county names with no date, no version, no FIPS and no boundary file, and a search of ArcGIS Online for a HIFCA feature service returns zero. The polygons are Census counties joined to those names, state-scoped — twelve US counties are named "Lake". The layer says exactly that in its own popup and in every export.
Built, driven and measured — 2026-08-23.
The case pack is read out of the PDF's own glyphs
Asserting an export as a string assembled in JS cannot see a document that prints blank. The browser suite drives the real button, prints the window and decodes Chrome's subset glyph ids through the font's /ToUnicode map. The first run failed on its own first line: window.open needs a trusted gesture, and a plain scripted click is swallowed silently — indistinguishable from an export that does not work.
The seed reproduces; the register does not
--repro rebuilds the extract byte-for-byte from seed 20260818. The FDIC estate is a live register — 5,384 offices on 2026-08-20, 5,381 on 2026-08-23 — so it is frozen as a build input, and the build reports drift instead of dying on it.
On-prem is a constraint, not a deployment note
MapLibre is vendored; at runtime the app calls nothing but keyless OSM-derived basemap tiles. The offline and browser suites are hermetic, and the network claim is asserted from the browser's own log rather than from reading the code.
Reading the figures: the 1,802 cells and their vintage, the 58 counties and their different vintage, the 5,381-office FDIC estate, and all three rule instruments with their statuses are real, published and probed. The alerts, the dispositions and the exposure denominator are GENERATED from one recorded seed (20260818) — anchored in magnitude to a published FinCEN figure divided by two stated illustrative parameters, never derived from geometry — and labelled in the notice bar, on the rate card, in the splash and in every export.
What this application will not do.
- No raw-count hotspot, anywhere. No clustering, no count-classed renderer, no bare count in an export. Every cluster states its denominator, its period and its test, or it does not render.
- No customer risk score, screening list or decline — and no exportable "high-risk area" artefact that could be pasted into an onboarding policy. It orders a work queue and nothing else.
- No county rate, at any zoom. 154 of 1,802 California ZCTAs straddle a county line, so a ZIP-grain rate cannot be rolled up without an allocation rule — and an allocation rule invented for a demo is exactly what a model validator exists to find.
- Alerts and aggregates, never a browsable ledger. The extract is aggregated inside the perimeter before the app sees it, which settles the record-level question by construction.
- An analytics layer, never a system of record and never the case system. Read-only end to end: disposition write-back needs a writable authenticated backend, and none is named.
- A desk, not a named officer. A per-analyst entitled queue needs row-level entitlements that have not shipped. The perimeter and SSO are the access control.
- Refresh, not streaming. A five-minute timer genuinely re-reads the extract and moves the as-of stamp. No stream, and no wording that implies one.
- It does not rebuild CPP or device geolocation. Those are solved, decades old and well served — and saying so is part of being credible in the room.
A geographic alerting device that ends in different treatment for the people inside a polygon is a live enforcement exposure — in the exact county this reference implementation demos over. Every boundary above is written into the delivered application's own README.
One extract.
Five columns.
Grain · period · location basis · exposure denominator · disposition. The last two are the ones that get left out of the request — and without them this is a prettier version of the count map it exists to refuse. Get all five in writing, and the queue reads your book instead of a generated one.
Swappable by configuration, not by code: the cell layer, the rule-geography instruments and their statuses, the exposure floor and α. No threshold, label or convention is hardcoded to a US rule — because there is no US rule, which is precisely why the method has to be printed on the artefact.