How many people fall
outside the standard —
and how much of that
is the standard?
Two published, citable distance conventions read side by side over the same estate on the same day — so the movement in the number can be attributed to the definition rather than to the branch network.
Whether that branch can be closed on the reasons you intend to give.
Section 42 of the FDI Act requires a 90-day advance notice to the primary regulator. The OCC's Branch Closings manual says the notice must carry "a detailed statement of the reasons" and "statistical or other information that supports the reasons for closing the branch."
A document, due ninety days out, that must contain a statistic about the effect on a community — and no prescribed method anywhere for producing it. That is the most concrete demand in the entire study, and it is the app's brief.
The service test itself counts branches, never people: 12 CFR 25.24(d) evaluates the distribution of branches across income classes. There is no distance in it, no travel time and no population. So the honest answer to "who is out of reach?" has no official form — it has to be constructed, and labelled.
Move any one of the three and the population outside changes without a single branch opening or closing.
Every incumbent artefact publishes one number produced by one set of three choices, and shows none of them.
There is no regulatory distance standard for branch coverage.
The rule has no distance in it
The CRA service test measures the distribution of branches across low-, moderate-, middle- and upper-income tracts. The unit is a branch; the denominator is a set of tracts sorted by income. Nobody is ever asked how far a person has to go.
So the standard is a vendor's or a researcher's
2 / 5 / 10 miles is the Federal Reserve banking-desert research convention. 3 miles (or five driving minutes) is a compliance-vendor convention used in branch-closing analysis. Both are real, both are citable, neither is a requirement.
And underserved is a term of art that means something else
The agencies' annual list designates nonmetropolitan middle-income tracts on remoteness codes — 59 in California. In metropolitan California the regulator's own word is definitionally unavailable, and it is never about distance to a bank.
The published brief named CRA 12 CFR 25 · FFIEC geocoding. Both are real and both are used here — but neither supplies the line. The app therefore prints the definition it used, on every number, every time.
Three lines called underserved. All in force at once.
| Whose line | What it is | Who may move it | Is it a requirement? |
|---|---|---|---|
| The bank's line | the assessment area — whole geographies, adjustable to "only the portion… it reasonably can be expected to serve" | the bank | Reviewed for compliance — not scored |
| The regulator's line | tract income class on fixed MFI thresholds (<50 · 50–80 · 80–120 · ≥120 %), plus a remoteness-based underserved designation | the agencies, annually | Yes — but it is not about distance |
| The analyst's line | the distance standard: 2/5/10 miles, or 3 miles, or 5 driving minutes | whoever is writing the report | No regulatory source whatsoever |
The failure mode of every incumbent artefact is that it publishes one number produced by one set of three choices and shows none of them.
So the six choices in force — service points, assessment area, income class, urban/rural, and both standards — are named on the face of the app, printed beside every numeral, pushed to the URL and carried into every export. And the app never prints the word underserved as a designation without saying whose definition it is. The choices are visible and switchable, never a settings dialog — hide them and this becomes a worse version of a consulting report.
Five things are produced today. The hole is in the middle.
| What is produced | By whom | Denominator | Standard used |
|---|---|---|---|
| Branches, and % of branches by tract income class | every CRA tool; the exam itself | tracts | none — no distance exists in the rule |
| Lending & CD activity inside vs outside the assessment area | Kadince · RiskExec · Ncontracts | the bank's own activity | none |
| Accounts and balances at risk if a branch closes | Bancography | the bank's own customers | distance to nearest surviving branch |
| One branch's closing narrative, drafted | GeoDataVision (on Maptitude) | that branch's service area | one convention — 3 mi / 5 min |
| People in banking deserts, nationally | Fed Communities / Philadelphia Fed | everybody | one fixed standard — 2/5/10 mi |
| The population reached and not reached by this institution's estate, under more than one standard at once | — | — | Nobody |
The nearest incumbent to this deliverable is a per-branch, one-standard, human-drafted document — professionally written after management review. The nearest published number is national, fixed-standard, and about no institution in particular, built on a licensed branch data set a bank cannot reproduce inside its own perimeter. The real incumbent, as always, is a spreadsheet.
Also read and recorded as verified non-benchmarks: Climate X · XDI · Jupiter · Moody's/RMS · HazardHub · ZestyAI carry no financial-inclusion, branch-coverage or CRA surface at all. They compete for the same budget, not for the same question.
The definition moves the number 3.6× more than six years of closures did.
Same estate. Same day. Same held 2020 population denominator. Move only from one published standard to the other and the California coverage gap changes by 905,077 people — 79 % of the smaller reading — while not one branch opens or closes.
Standard B · 3 mi uniform = 2,054,547 in 595 tracts
= the definition alone 905,077 people
six years of real closures (1,243 branches, −18.5 %) 253,440
which points count (all FDIC offices vs full-service) 10,244 · 0.9 %
So the definition worth arguing about is the distance standard — and the app says so on its face rather than making a reader discover it. The other axes are on screen too, because measuring which choice does not matter is what earns the right to say which one does.
Everything needed to check the number is on screen.
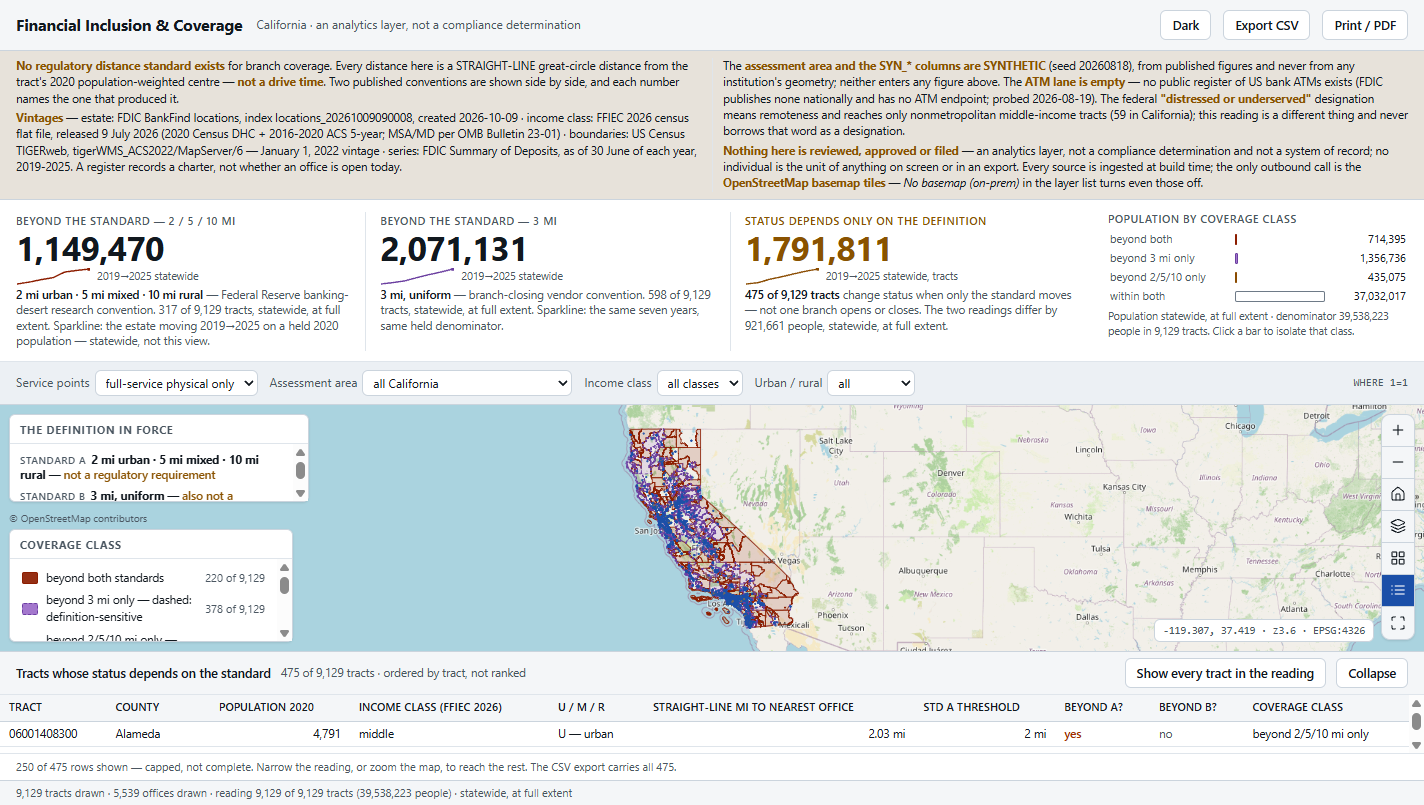
- A standing notice bar that may not be collapsed: no regulatory standard exists, every ring is straight-line, which lanes are synthetic, and every vintage on screen.
- Three captioned numerals. Both readings and the count that is definition-sensitive — each caption naming the convention that produced it.
- The six choices in force, named in the card, ANDed into one WHERE that is printed on screen and pushed to the URL.
- The legend filters, and counts. Click hides a class — a real definitionExpression, so fewer features render. Every row keeps its denominator (375 of 9,129).
- The ATM lane ships empty, visible and captioned with its probe. An omitted layer reads as an oversight; an empty one labelled with its evidence reads as a finding.
The tracts whose status depends only on the definition.
Not "1.1 million people are beyond the standard" and not a league table of the worst-covered tracts, but the count of tracts that change status when nothing changes except the line — and the population they carry.
carrying 1,775,227 people
— no branch opens, no branch closes, no boundary moves
This is the only figure that can be handed to an examiner, or read out at a community meeting, as an honest statement of what the record does and does not depend on. It also protects the institution: a coverage claim that survives both standards is a far stronger sentence in a 90-day notice than one that survives the single standard its author picked.
Four classes, never a continuous ramp. A ramp invites a reader to eyeball a threshold that is the entire subject of the app.
| beyond both standards | 220 | 714,395 | 1.81 % |
| beyond 3 mi only | 375 | 1,340,152 | 3.39 % |
| beyond 2/5/10 only | 97 | 435,075 | 1.10 % |
| within both standards | 8,437 | 37,048,601 | 93.70 % |
Move the line, watch the number move.
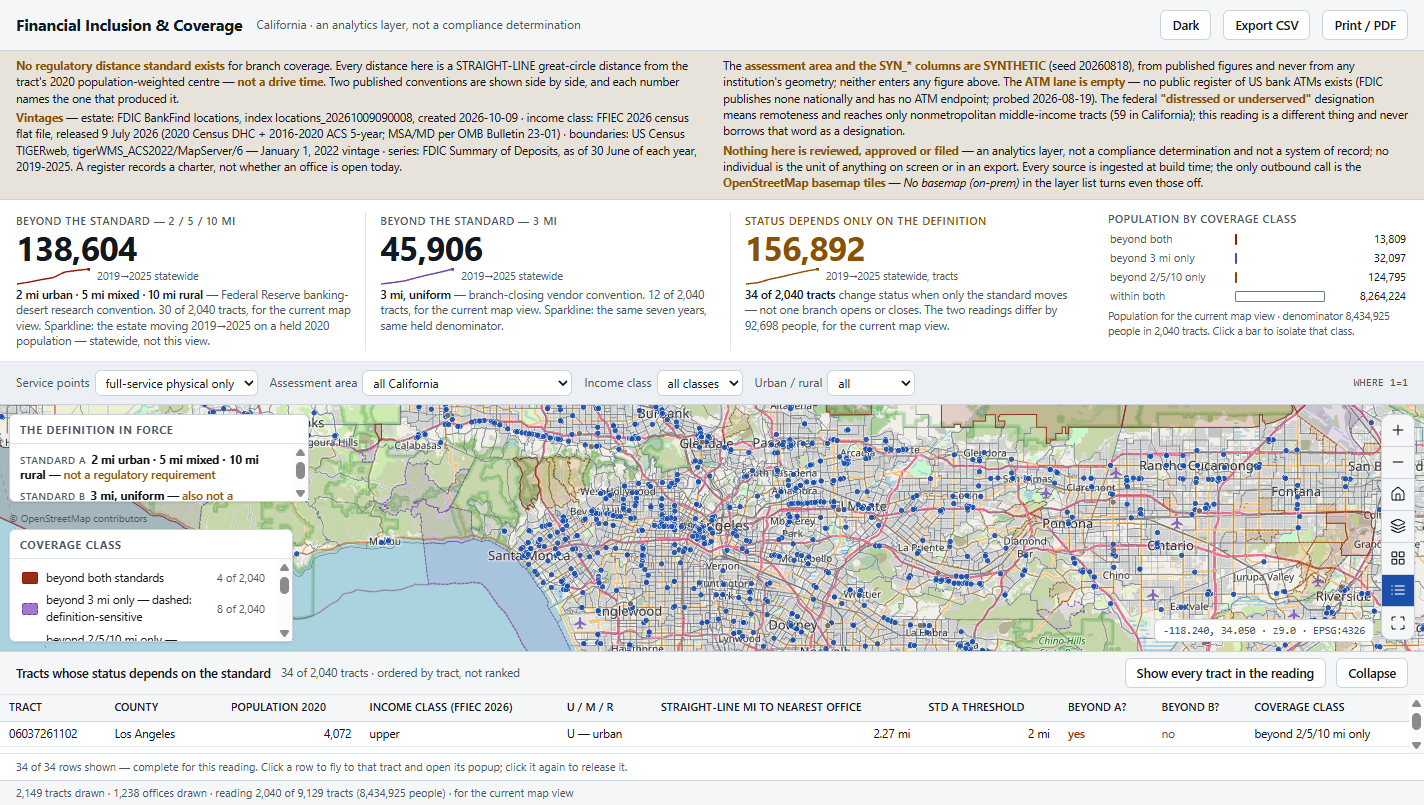
The reading follows the reader; the definition does not follow the reading. That asymmetry is the whole design.
- Pan or zoom — all three numerals recompute together, so the pair is never read at two extents.
- Move a chip — map, numerals, chart and list re-scope at once, and the reading is pushed to the URL.
- Click a class — the map isolates it as a real filter; the list re-scopes and keeps its denominator.
- Click a row — the map flies to that tract, flashes it, and the popup prints the measured distance and both standards. Click again to release.
Built, driven and measured — 2026-08-20.
The on-prem boundary is satisfied by construction
Every source is ingested at build time; the app opens having made no outbound network call, and ships a No basemap (on-prem) option that leaves the perimeter untouched. Asserted from the browser's own network log.
Nothing is a lookup of a precomputed answer
The domain module re-derives every tract's class from the two standards on every reading, so switching a chip cannot leave a stale figure behind. The §4 control totals are asserted to reproduce exactly.
The finding nobody expected, reported anyway
The California gap is not primarily an LMI phenomenon: 40,346 people in low-income tracts are beyond Standard A, against 433,693 in middle-income and 267,684 in upper. An app that assumed the answer would have shown the opposite.
Reading the figures: boundaries (US Census TIGERweb, 1 January 2022 vintage), the income classification (FFIEC 2026 flat file, released 9 July 2026) and the branch estate (FDIC BankFind, index locations_20260814090007) are real, published and probed. The assessment-area polygon and the SYN_* lending columns are GENERATED (seed 20260818), labelled on every screen — and neither enters any of the three numerals.
What this application will not do.
- An analytics layer, never a compliance determination. It evidences a coverage record. It never asserts that the institution passes anything, and nothing here is reviewed, approved or filed.
- Straight-line distance, never drive time. A drive-time reading needs a self-hosted router inside the perimeter; none is named, so none ships. A public keyless router is refused as a security finding, not a rate limit.
- No citation is hard-coded. The 2023 rule was enjoined and never applied; a joint OCC/FDIC NPRM closes 13 October 2026; the Federal Reserve did not join. The app is built on the one object three rulebooks agree about.
- The ATM lane is empty — and that is the finding. No public register of US bank ATMs exists. It is captioned with its probe, and never synthesized.
- Aggregates only, read-only. The finest grain anywhere on screen or in any export is a census tract. No write path, no per-user row entitlement.
- Refresh, not streaming. The estate is a stated configuration as of a date. A register records a charter, not whether an office is open today — there is no refresh timer, deliberately.
- M is mixed, not suburban. The FFIEC file has no suburban class. Mapping it to 5 miles is this app's assumption, printed as such.
- English only, and California only. California is where the method is provable, not where the buyer is. A Gulf port is a separate study, not a translation.
Every one of these is written into the delivered application's own README. A tool that hides its edges costs you the project it cannot finish.
One branch list.
One declared boundary.
Your offices with their coordinates and service types, your declared assessment area, and the standards you intend to defend. Two weeks, and this scoreboard reads your estate instead of a public register — inside your perimeter, calling nothing.
Swappable by configuration, not by code: the boundary set, the population source, the classification, and the standards themselves. The distance standard is a field, not a constant — the app renders a typology of lines, it does not ship a list of US numbers.