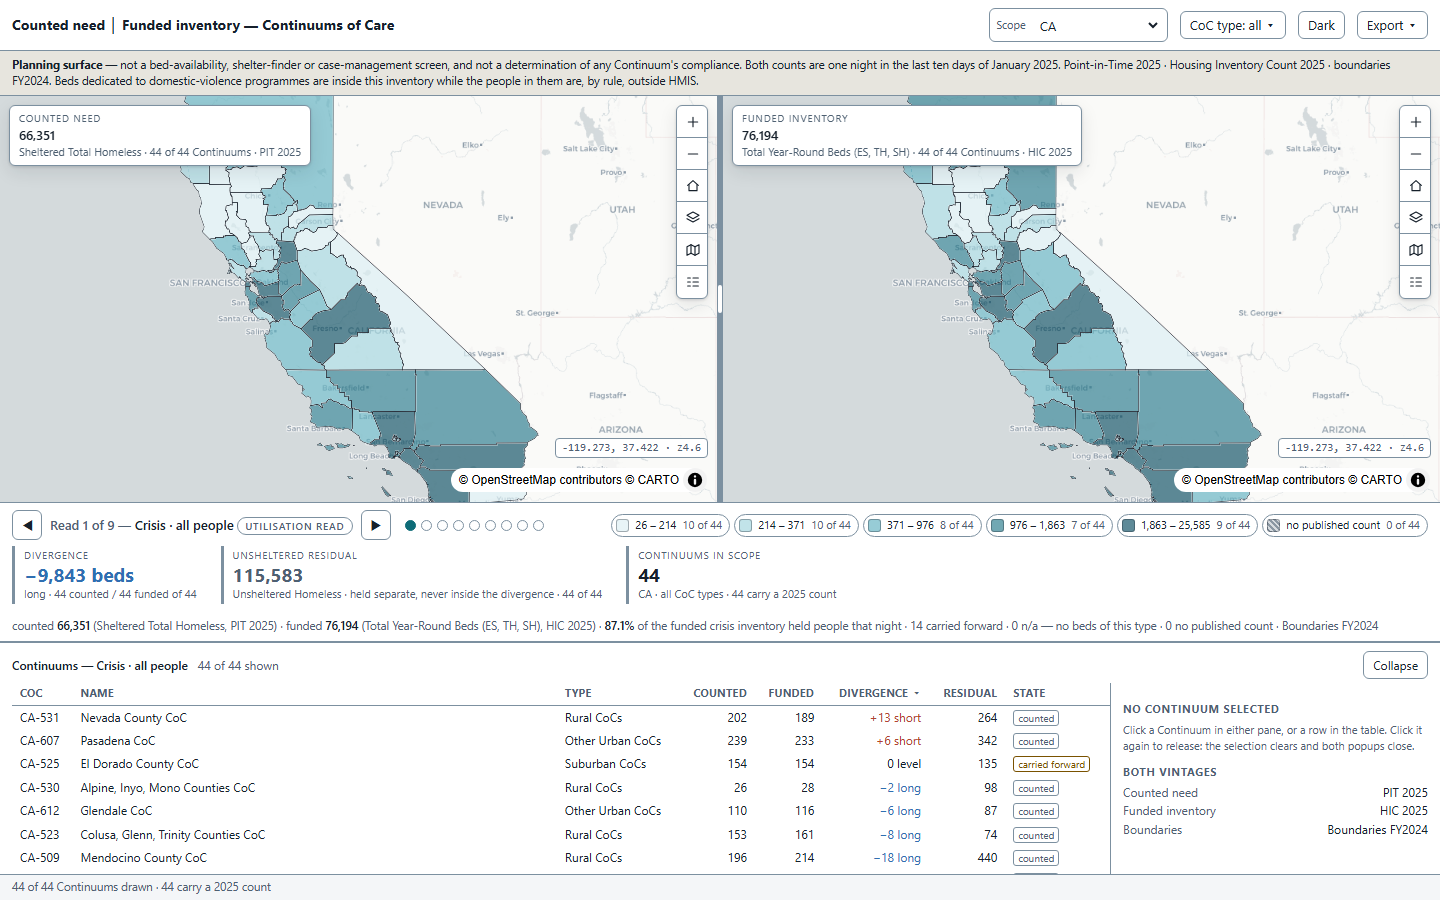
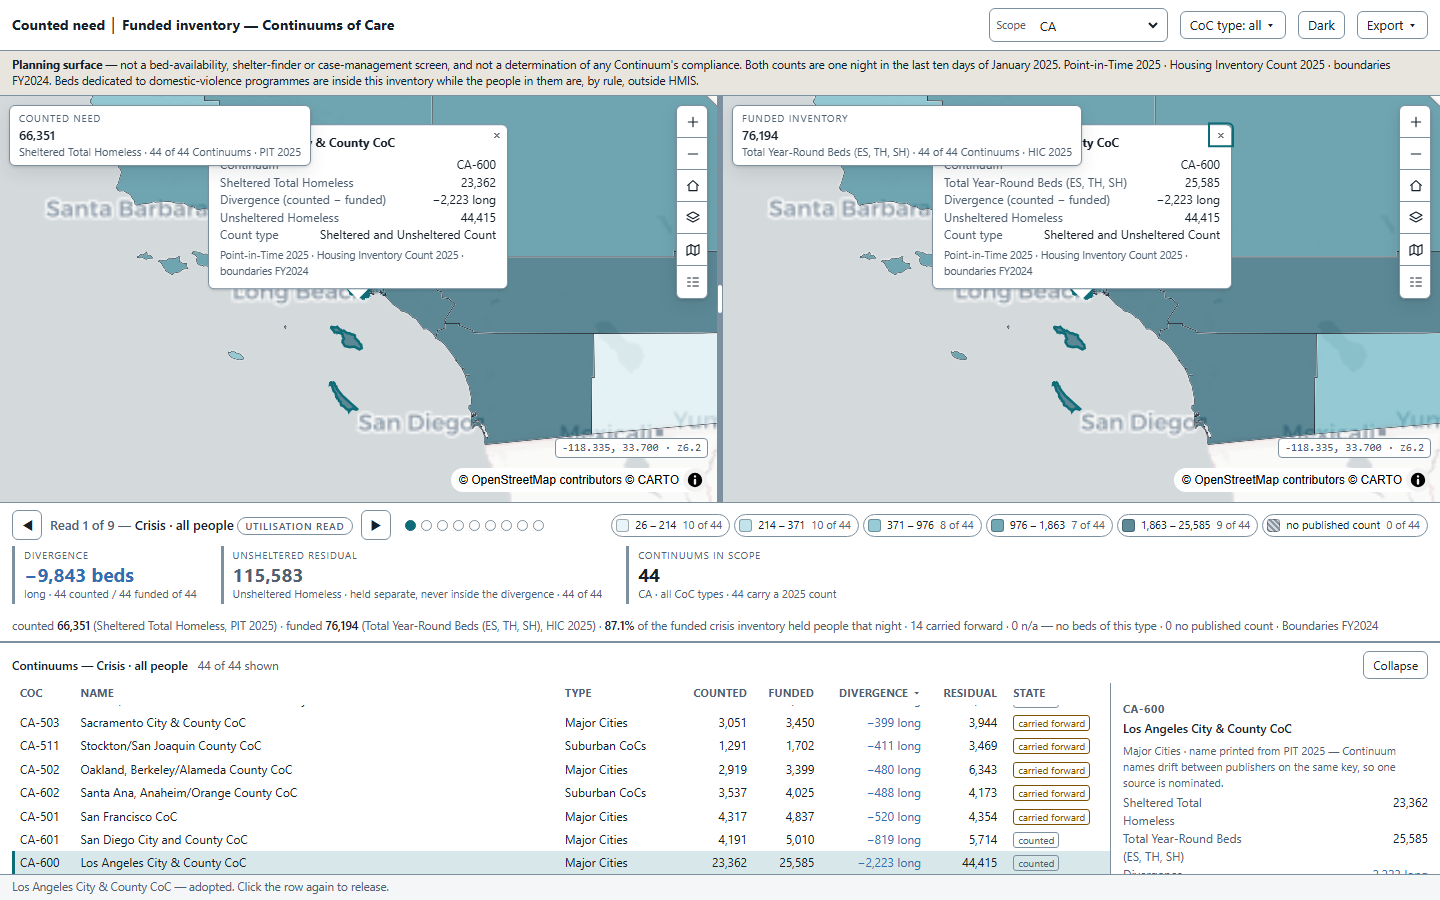
A Continuum's counted need beside its funded inventory, for one reference night, on one shared class-break set — so a colour means the same quantity in both panes. The divergence carries its sign and its word, and the unsheltered residual sits beside it, never inside it.
The annual gaps analysis obliged by 24 CFR 578.7(c)(3), the homeless-needs input to the Consolidated Plan, the System Performance section of the CoC Application — 40 points of it — and, in California, the system performance and improvement plan inside the HHAP regional action plan.
Deliberately not "find a bed for this person tonight." That is a case-management action, it requires a write path, and it touches beneficiary data. This is a planning surface, and it says so on screen and in every export.
The person who owes the gaps analysis is the person who buys the application. There is no private-buyer reading of this product, and none is offered.
115,583 people were outside that inventory that night.
A utilisation percentage on its own reports a system with room to spare. The residual is the half of the count that ratio is structurally blind to — which is why it sits beside the divergence and is never folded into it.
| What exists | What it is | What it does not do |
|---|---|---|
| HUD HDX 2.0 | where every Continuum submits both counts | Login-gated submission system — where the numbers are born, not where anybody looks at them across a geography |
| HUD's per-CoC report PDFs | the PIT as subpopulations; the HIC as beds by type | Two charts, one PDF, one Continuum, once a year — no way to set one against the other or against the next Continuum |
| HUD's CoC GIS Toolkits | boundaries, geocodes, HIC and census, per state | A download for ArcGIS Pro. Federal catalogue record last updated 31 Dec 2019, ACS 2010–14, no REST endpoint named |
| Esri's health & human services set | PIT collection · shelter status · service locator | Owns the collection leg and the live-operations leg. Nobody owns the read |
| Built for Zero · the HMIS tier | the by-name list, person-level, real time | Inside the perimeter, and its unit is a person — the shape a public artefact may not wear |
| NAEH State of Homelessness | the only verified product with both 2025 counts in one place | Interactive charts, not a map — and it does not resolve the two against each other by project type and dedicated subpopulation |
| The regulated deliverable itself | a Gaps Analysis & Needs Assessment | A PDF every few years, assembled from provider surveys and interviews, with no stated formula for computing a gap |
The annual gaps analysis that federal rule requires is, in practice, a consultant report produced every few years from interviews — while the two published counts that could answer a large part of it are already sitting in the authority's own files.
Only people in emergency shelter, transitional housing and safe havens are in the sheltered Point-in-Time count. That is what the count is.
People in permanent supportive housing, rapid re-housing and other permanent housing are not homeless, and are not in the PIT. Their beds are still in the inventory.
All beds minus all counted people reports the largest surplus in the Continuums that built the most permanent housing — the exact inversion of the truth.
gaps.mjs throws when asked to pair a count across the crisis/permanent boundary, and three live assertions prove the throw. No control anywhere in the interface can produce it — a stronger guarantee than a footnote saying not to.
This is the single most likely way an application in this space ships a confident, inverted, wrong answer. It is why the project-type axis is load-bearing from the first line of the build, and not a filter added later.
"Conducting an annual gaps analysis of the homeless needs and services available within the geographic area."
| Kind of read | What it pairs, and why that is legitimate |
|---|---|
| Utilisation reads 1–4 | the sheltered count against crisis inventory (ES / TH / SH) — the count counts exactly the people who were in those beds that night |
| Dedication reads 5–9 | a counted subpopulation against the beds dedicated to it — because bed-level targeting for those three is exactly what the reporting rule collects |
The strip names which kind is on screen at all times. The pairing is fixed by the reporting rule, never chosen by the reader — which is what stops this becoming a chart builder.
Permanent inventory appears in exactly one place: a labelled stacked bar in the detail pane, captioned "permanent inventory — shown, never differenced against a count."
| # | Read | Counted need · PIT 2025 | Funded inventory · HIC 2025 | California divergence |
|---|---|---|---|---|
| 1 | Crisis · all people | 66,351 | 76,194 | −9,843 long |
| 2 | Crisis · emergency shelter | 56,290 | 62,521 | −6,231 long |
| 3 | Crisis · transitional housing | 9,739 | 13,292 | −3,553 long |
| 4 | Crisis · safe haven | 322 | 381 | −59 long |
| 5 | Dedication · chronically homeless | 68,949 | 23,833 | +45,116 short |
| 6 | Dedication · veterans, crisis | 2,498 | 2,553 | −55 long |
| 7 | Dedication · veterans, permanent | 8,686 | 29,786 | −21,100 long |
| 8 | Dedication · youth, crisis | 3,503 | 3,308 | +195 short |
| 9 | Dedication · youth, permanent | 8,086 | 3,239 | +4,847 short |
Reads 6/7 and 8/9 are split on purpose. A veteran read that folded crisis and permanent inventory into one denominator would smuggle the forbidden subtraction back in through a side door — permanent dedicated beds hold people who are no longer counted. Split, the crisis side sits within 55 beds of level while the permanent side is long by 21,100. Combined, it reports a comfortable surplus and hides both facts.
Three subpopulations, not four, and the limit is the rule's. A tenth read would be a comparison against a number that does not exist — and HUD's own served copy of this data has exactly that hole, which is why this is a design rule and not a nicety.
The ramp is identical in light and dark. A data colour that followed the UI would make two screenshots of the same reading disagree — and this app's whole argument is that two pictures of the same thing can be compared.
What the authority already derives from these two counts is a utilisation rate: a ratio of the sheltered count to the beds that held it. It is not a gap, and it is structurally blind to the half of the count that was outside.
Direction is never carried by colour alone. Every divergence prints its sign and the word short, long or level, so the reading survives a monochrome print and a colour-vision difference. Two tokens per direction — a fill and a text value — measured at 5.20:1 or better in both modes.
Step the read and the breaks, both pane labels, the divergence, the residual, the table's title and sort, and the legend's counts all move in one frame — because they are one expression.
carried forwardthe unsheltered figure is not from this year's night — 14 of California's 44not countedsheltered-only, and no unsheltered figure. Never 0n/a — no beds of this typethe literal . in 447 cells. Never 0 % coverageno published counta boundary with no row. Never the lowest classno boundary publisheda row with no polygon. Never a silent omissionsuppressednever a blank, and never a computed gap of zero
The outbound half — row to map — is what every viewer in this shape ships. The inbound half is the one they skip, and without it the second pane is a picture rather than a partner.
Both sheets carry duplicate headers whose copies happen to agree on all 386 rows — so a header-keyed read is wrong by luck, not wrong in value, and passes every spot check. The build reads by index and asserts the header text at 21 inventory and 18 count indices.
The national view fitted a footprint spanning the antimeridian and drew the whole world. At phone width the divergence readout — the product — was pushed off the screen entirely. Both were green on every non-visual assertion.
The lon/lat chip painted over the OSM/CARTO attribution by 152 px per pane. Not clipped — covered — so the element's own metrics were clean. The guard now tests the attribution's rectangle against every opaque thing the pane paints, at both widths.
Reading the figures: every number here is HUD's published 2025 Point-in-Time count, 2025 Housing Inventory Count and FY2024 CoC boundaries, probed 2026-08-24 and re-verified against the live hosts 2026-08-25. Nothing in this application is generated. Where a source carries no value, the app names the absence rather than filling it.
All of it is written into the delivered application's own README — alongside the three Continuums it names rather than drops: TX-625 has counts and no published boundary; AS-500 and MP-500 have boundaries and no published count. A tool that hides its edges costs you the project it cannot finish.
Nothing to extract and nothing to license — the spine is HUD's own published Point-in-Time count, Housing Inventory Count and CoC boundaries. Name your Continuum, or your state, and this reads your geography instead of California's.
The rule is federal, so the build is national. Any of the several hundred Continuums in the United States rests on the same published material and the same obligation. Behind your own perimeter it reads your finer aggregation the same way — where a suppressed cell will meet it on the first afternoon, and read suppressed.