Where is the outcome worse
than the conditions explain?
Every California census tract: measured life expectancy against what the state's own index of community conditions predicts — carried with its uncertainty, so a gap counts only where it clears the measurement's own error. Most of the map is not a finding, and saying so is the product.
Where the department puts the next intervention — and how it defends the choice.
A county public-health department targets a programme, and a grant writer or designation-comment author has to justify that target in writing. The obligation is calendared: an accredited health department must complete a community health assessment and improvement plan at least every five years, and must show how its priorities were selected.
The published indices already say where conditions are bad. The department knew. The residual says a tract is doing worse than other tracts in the same condition — which points at something local and modifiable rather than at the structural conditions no single grant will move.
They hold 2,238,554 people. Inside the designation: 220.
That designation carries 25 % of California's cap-and-trade investment, with 10 % required to be located inside it. Two thirds of the tracts doing measurably worse than the index predicts are not in it.
The obvious build subtracts one expectation from another.
The brief pointed at a modelled prevalence surface scored against a demographic vulnerability index. Four page-verified grounds say that pairing does not survive — and it fails structurally, not by tuning.
It is already an expectation
The publisher's own FAQ: the local estimates are "the statistically expected prevalence … based on the associations observed through the overall model." Subtracting a second expectation gives the difference between two functional forms.
Both sides share inputs
The outcome is poststratified from age, sex, race/ethnicity, education and poverty. The index is a rank over 16 ACS variables built from the same material. The predictor re-ranks what the outcome was manufactured from.
A federal publisher already refused it
CDC/ATSDR's Environmental Justice Index degrades each of those health measures to a top-tertile flag — stated reason: to avoid double-counting the demographics used to build them.
In California it is now literal
CalEnviroScreen 5.0, released 1 July 2026, adds a diabetes indicator drawn from that same modelled surface. The state's designating index now contains it. Same number on both axes.
The repair is stronger than the original: swap the outcome from a modelled prevalence to a measured one — life expectancy built from death certificates and population counts — and hold every health measure out of the predictor. The in-sample caveat disappears with it, and R² becomes a real number.
The dangerous join is the one that succeeds.
The measured outcome is published on 2010 census tracts. The obvious vulnerability comparator is published on 2020 census tracts. A GEOID join between them returns 6,434 of 7,516 rows — 73.9 % of California's population — with no error, no warning, and a plausible statewide map.
A builder ships a map missing a quarter of the state and reads the hole as a data gap. The house rule was written against a join that returns nothing; this one returns most of it.
So the whole application runs on one tract vintage, and says so on every screen and in every export. The 2020-vintage index appears nowhere in it — not as a predictor, not as a comparator, not as a layer — and the capability sweep records that omission with this reason.
Crosswalking forward was considered and rejected: it means allocating a measured life expectancy across a boundary split. Allocation is a modelling act, an allocated value is not a measurement, and an app that did it silently would be inventing the number it exists to publish.
The chain, measured — and it nests with zero orphans
└─ 8,035 scored by the conditions index (1 outside the polygon set)
└─ 7,516 with a measured life expectancy (0 orphans)
└─ 7,105 also carrying all six predictors
└─ 980 separable → 665 worse · 315 better
Asserted in a suite, because a silently partial join is indistinguishable from absence. The build aborts rather than ship one.
Sixteen numbered traps, one estate
A conditions layer served in California Albers whose first vertex reads [-39795, -341919] without outSR. A tract key that is a Double on one side and an unpadded string on the other. A quintile band that is not a confidence interval. A tract service with no layer 0. And four different spellings of the object-id field, with objectIdFieldName null on every layer — including a decoy column literally named OBJECTID that is not the OID.
A residual, with a separability test.
No publisher issues it. The two national indices publish the two sides and no comparison; the state index fits a regression against life expectancy and reports only the fitted score, never the per-tract residual; the national dashboards clip to city boundaries or stop at county level; and the ready-made vendor layers ship both datasets while computing no expected-versus-observed quantity at all.
+ 0.002682 × PollutionP − 0.024211 × eduP + 0.038354 × lingP
− 0.066743 × povP − 0.008074 × unempP − 0.001482 × housingBP
a tract is a finding only where |residual| > 1.96 × its own published SE
→ 980 of 6,138 testable tracts are separable — 16.0 %
The three health indicators the conditions index publishes — asthma and cardiovascular ED visits, low birth weight — are held out of the predictor because they are outcomes, and appear as context only. They can never carry the separability test: the index publishes no interval on any indicator, and the app says so wherever they appear.
445 — holding 2,238,554 people — lie outside the SB 535 Disadvantaged Communities designation.
Inside it: 220. The designation covers 2,310 tracts and carries 25 % of California's cap-and-trade investment.
The gap is published, and it is not our claim
A 2024 American Journal of Epidemiology study geocoded roughly 1.98 million California deaths to tracts and stratified by index decile: an all-cause rate ratio of 1.63 between the 1st and 10th deciles, population attributable fraction 24 %. Its conclusion is the sentence this app is built on — interventions that only focus on the first two deciles will not address the roughly 65 % of attributable deaths occurring between the 20th and 80th.
Every rule that spends money here targets the top of an index. Most of the burden is not there.
Four of the six states are refusals — and they hold 87 % of the map.
Every one of the 8,057 tracts renders in exactly one state, each with equal standing in the legend, the charts, the table and every export. "Not a finding" is a rendered state, not a footnote — selectable, countable, brushable and exportable, exactly like the two that are findings.
The outline carries separability, never the fill
The smallest separable residuals sit close to the neutral ground by design — a −1.5-year fill measures 1.43:1 against it. If fill alone carried the distinction, a ±2-year finding would be invisible and a reader would infer there was nothing there. A 1 px outline is categorical, reads at every zoom, and survives a greyscale print.
And the calm ground had to be built, not chosen
At the first pass, not separable — 64 % of the tracts and the app's whole first message — measured 1.09:1 against the basemap. Most of California read as no data rather than covered and not separable. A grey fill cannot separate from a near-white basemap without growing loud enough to compete with the ramp. The fix borrows the design's own logic: covered ground is carried by the tract mesh, the refusals overlay textures on top of it, and the textures were quietened by a third — because absence was shouting louder than findings.
A chart board, not a map viewer.
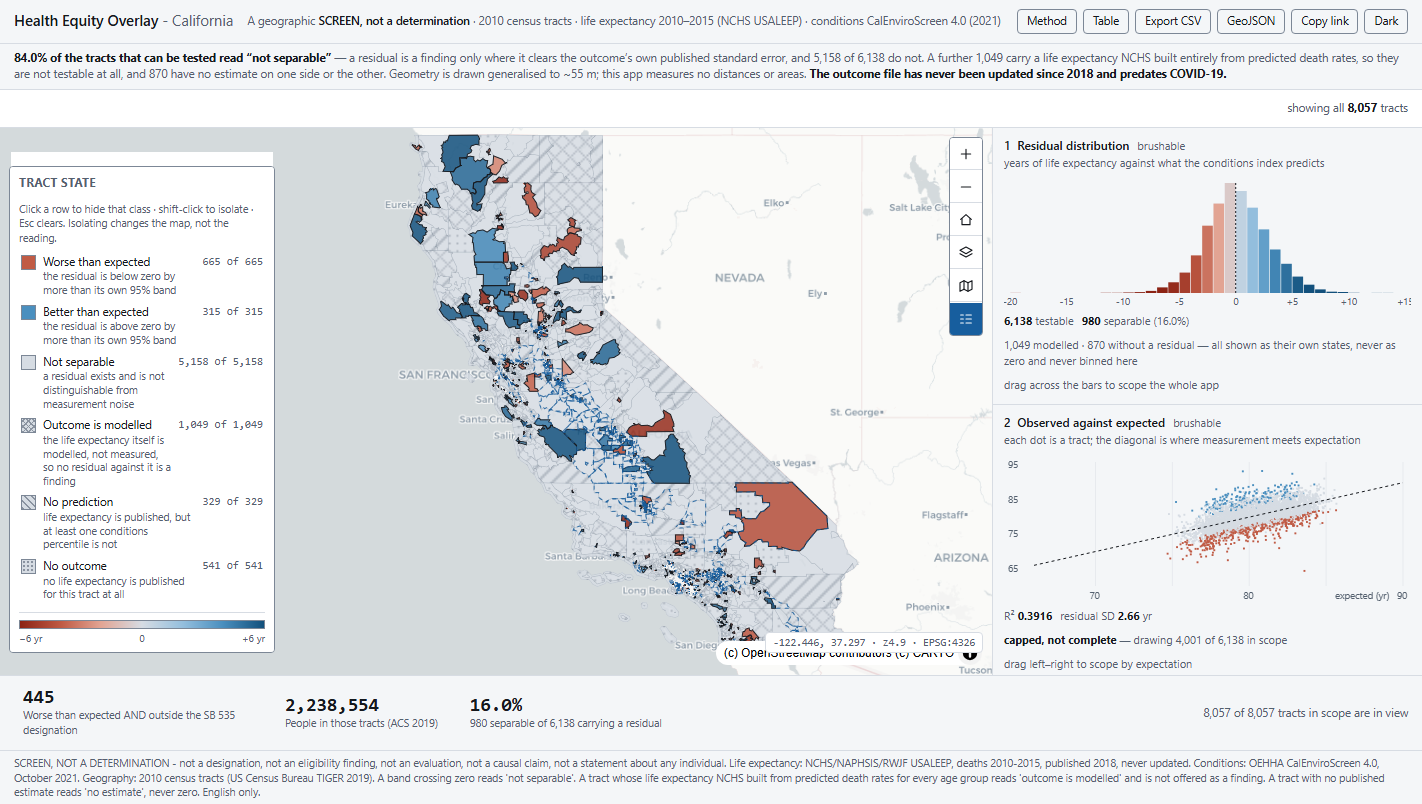
- The scope sentence, in the header. A screen, not a determination · the tract vintage · both source vintages · the language. It never scrolls away.
- A notice bar that computes itself. 84.0 % of the tracts that can be tested read "not separable" — derived from the state counts, so it cannot go stale when a state is added.
- Brushable charts as the protagonist. Residual distribution, observed-against-expected, conditions decile, designation split. Each cross-filters the others and the map.
- A legend that filters and keeps its denominators. Click hides a class, shift-click isolates, Esc clears — a real filter on the source. No row can read 0 of 0, and each swatch carries the map's own texture.
- Three KPIs, each of them clickable — and each scoping the app to the population it counts.
One gesture. Seven surfaces. No submit.
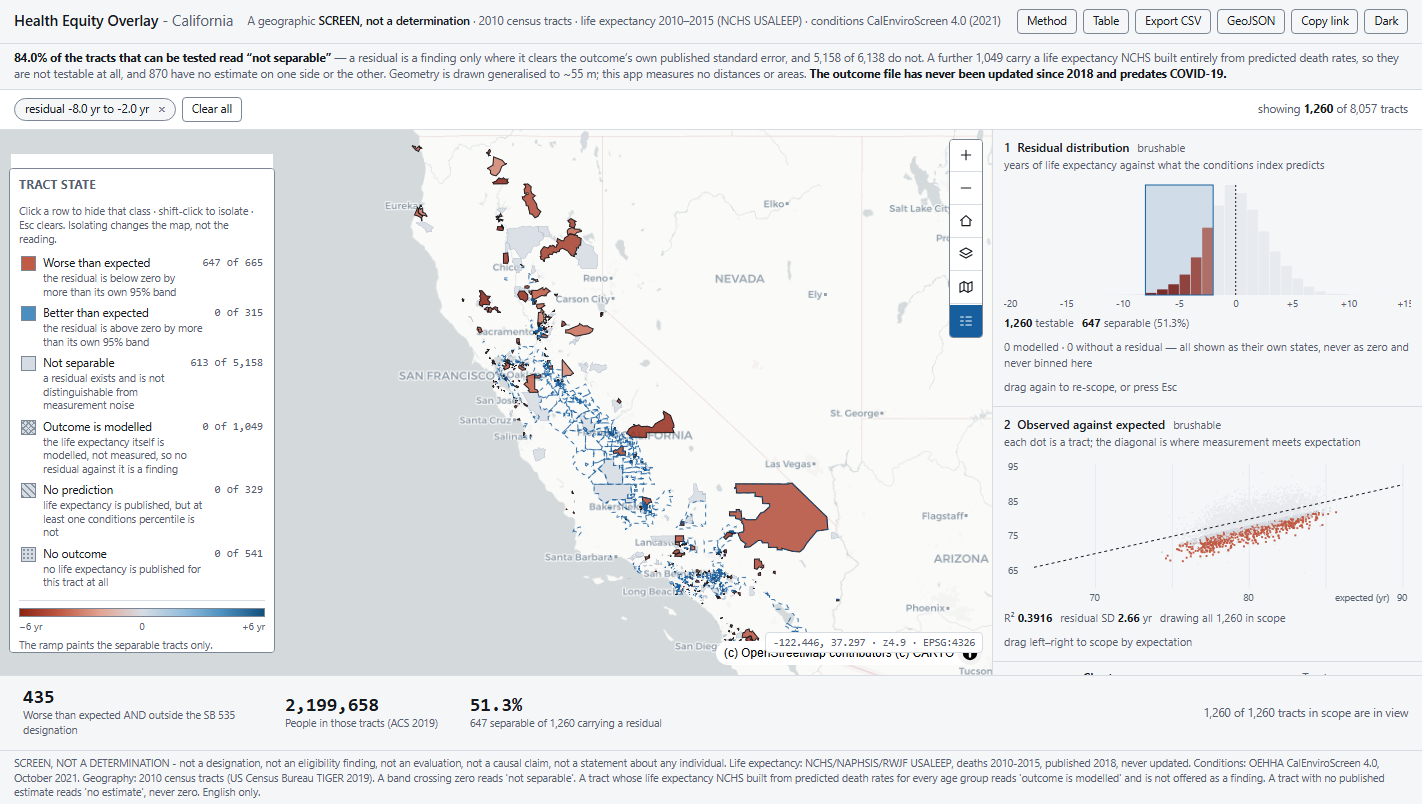
Brushing is the whole product. The map, the scatter, the decile bars, the designation split, the table, the chip row and both KPIs follow in one drag — and the scope becomes a deep link that round-trips through a cold load and rejects a hand-edited state.
- Predicates stack. Click a conditions decile and it joins the band as a second chip; remove the first and the second still stands.
- Adoption is bidirectional, and it releases. Click a tract and it pins — record, popup, Tract tab. Click it again and it lets go. A table row does the same.
- A brush may only select what its own chart shows. The predicate and the map filter are checked against each other on all 8,057 tracts across ten scopes.
- Nothing truncates silently. +N more on the chips, capped, not complete on the table, and the scatter states its own draw cap.
A code order inferred from prose.
The outcome file carries a flag saying whether a tract's life expectancy came from observed death rates, from predicted ones, or from a combination. Its code book was unreachable during research — the publisher's documentation hosts returned 403 to every machine fetch — so the flag was carried as a raw code and gated on nowhere.
During the build those hosts answered 200, and the record layout decoded the flag in the opposite order to what the landing page's prose implies. That page lists the categories as "exclusively observed, a combination …, or exclusively predicted" — read as a code order, that makes the fully-predicted class 80.5 % of the state. It is not that class. It is 14.0 %, which makes the rule both applicable and cheap.
2 = PREDICTED, all age groups 1,049 tracts mean SE 1.6488
3 = combination of the two 6,051 tracts mean SE 2.0257
Why it mattered more than a miscount
The fully-predicted class carries the smallest published standard error of the three. Those tracts were therefore the most likely to clear the separability gate — a modelled outcome sailing through the very test designed to protect a measured one.
97 "worse" and 13 "better" tracts were being called findings on a life expectancy that was itself entirely modelled — the same expectation-minus-expectation circularity the whole design was rebuilt to avoid, having crept back in through a footnote.
It is a sixth rendered state now. The headline moved from 512 tracts / 2,566,562 people to 445 / 2,238,554. The fit itself is untouched — n, R² and every coefficient still reproduce to six decimal places, because this is a rule about what counts as a finding, not about the regression.
A guard that matched its own host
The assertion enforcing "no bound service is a 2020-vintage one" tested a pattern against the whole URL — and the host of the 2010 geometry spine contains the exact substring it was hunting. A substring test over a URL is a substring test over somebody's hostname. It matches whole path segments now.
A map that exists and paints nothing
One invalid style key produced a live map object, a sized canvas, a working WebGL context — and a white rectangle with an empty console, because no error handler was registered. Both non-visual suites were green. Only the screenshot showed it.
Built, driven and measured — 2026-08-24.
The build refuses to ship a silent failure
The reconciliation is an abort condition, not a warning: the chain must nest at 7,516 ⊆ 8,035 ⊆ 8,057 with one named exception, every GEOID must be 11 characters, no residual may exist without a measurement, and the six state counts must sum to 8,057.
The arithmetic is on screen
A method drawer carries the intercept, all six coefficients, n, R², the residual SD, the mean published standard error, what is held out and why, the not-causal warning on the positive sign — and the outcome file's own Last-Modified, so the vintage is a fact from the wire rather than a claim.
Every export carries the limits
CSV and GeoJSON of the live filtered view, both vintages, the equation, the scope as a reproducible predicate, and the completeness statement. No cell is ever blank — every column falls through to a word: no estimate, not published, not applicable.
Two stated departures from the house defaults, each with its reason on the page it affects: the two themes carry different ramps, because a ramp's job is to diverge from its ground, the ground differs by mode, and one ramp cannot clear 4.5:1 against both; and polygon fills run at ~85 % alpha rather than the house ~40/255, because this choropleth is the reading — the rule the low alpha protects is met instead by drawing the designation as an unfilled outline above the fills.
What this application will not do.
- The vintage limit is the largest weakness, and it is on every screen. The outcome file is a one-time product covering 2010–2015, published in 2018 and never updated. It predates COVID-19 entirely. This is a structural read, not a current one.
- A screen, never a determination. Not a designation, not an eligibility finding, not an evaluation of any programme, not a causal claim. A residual names a discrepancy, never its reason.
- Never patient-level data, under any framing. Only the publishers' own tract aggregates, already suppressed and flagged. There is no record-level path anywhere in the app.
- No subgroup, no age band, no race-stratified residual. The publishers do not release those at tract level, and manufacturing them would be the disclosure defect the boundary exists to prevent.
- Read-only, end to end. No write path, no per-feature edit, no case-management surface — so it runs identically on Strata Serve and on ArcGIS, because it never writes to either.
- On-prem, behind the perimeter. Keyless basemaps, one bundled operational layer, no install step. The single outbound lane is a context layer that is off by default, labelled as leaving the perimeter, and the app is fully usable if it never loads.
- It measures no distance and no area. Geometry is generalised to ~55 m for drawing and the notice bar says so. There is no travel axis anywhere — the axis is outcome.
- One region, English only. The argument depends on an outcome file, a conditions index and a designating rule existing together on one tract vintage. A deployment elsewhere needs its own three.
Every one of these is written into the delivered application's own README. A tool that hides its edges costs you the project it cannot finish.
One measured outcome.
One conditions index.
One rule that spends money.
A tract-level outcome that is measured rather than modelled and carries its own standard error, a published index of conditions with no health measure inside it, and the designation or allocation rule your budget actually follows. Those three on one geography, and this residual map reads your jurisdiction instead of California.
Swappable by configuration, not by code: the geography, the outcome, the predictor set and the designation. Nothing in the six states, the separability gate or the export is hardcoded to a Californian rule — they are a typology the app renders, not a list of numbers it ships.