__MK__tabaqat · StrataHealth & Community
The Catchment Ledger — Facility Capacity & Catchment

Which places actually
depend on this hospital?

One facility's record, on one page: what it is licensed to do, what it reported doing, which ZIP codes supplied its patients — and the number nobody publishes: how much of those places' demand went somewhere else.

California reference implementation · 458 licensed acute hospitals · 658 assertions green On-prem · no keyed provider · map library vendored, no CDN at runtime
© 2026 Tabaqat · Built on Strata — sovereign geospatial applications. Every figure traces to a published file, a stated disclosure floor and a named year. Nothing in this application is synthetic.
The decision this drives

Whether this site can absorb more — and whether a service line is bleeding.

Read at a service-planning and facility-review desk, not at a capital committee. In practice: screening a material-change notice, a bed-classification filing, a distressed-facility watch, or a county asking what a change at one hospital would mean for the places that use it.

Which is why the unit of answer is a single facility's record — never a rank. The chooser is ordered by name within county, never by occupancy or volume. A ranked chooser would make this a league table, and a league table answers a budget question this app deliberately does not own.

Buyer: public health-facility planning analyst Reads over the shoulder: county health · licensing reviewer · the facility itself
4clauses in one sentence — and every incumbent sells one of them separately

This facility serves these places, holds this much of their demand, loses this much of it, and has this much licensed capacity per ten thousand of the people who actually use it.

The publisher of the data answers two of the four — on two different screens, with no way to put them on one record.

The finding that shaped the app

Capability, utilisation and the real catchment are all published. Nobody joins them.

So the capacity question gets answered against the wrong shape

Against a county, a drawn radius, or a plurality-assigned market area — none of which is the set of places that actually use the building.

The standard the brief cites declines to model it

WHO SARA v2.2 says service availability "does not include more complex dimensions such as geographical barriers, travel time and user behaviour" — and its densities are computed on administrative units. The right-hand column of this ledger is precisely what SARA leaves out.

The federal catchment standard cannot express a shared ZIP

Hospital service areas assign each ZIP to exactly one hospital, "where the greatest proportion of Medicare residents were hospitalized" — 3,436 HSAs, winner-take-all. A ZIP split 45/40/15 is recorded as belonging wholly to one of them.

Two more corrections came out of the study, and both are load-bearing: California repealed its Certificate of Need programme in 1987 — so here the app informs a screening judgement rather than feeding a determination — and the exact question "which places depend on it" cannot be answered without patient-level data. So it was reshaped to what an aggregate can answer, precisely.

The reshaping, and the moral centre of the design

87.8 % of California's origin cells are withheld by the publisher.

"Which places depend on it" is, at full resolution, a statement about individual discharges — records that may never enter this template under any framing: not de-identified, not sampled, not "just for the demo". So the question became: which ZIP codes depend on it above the publisher's own disclosure floor, and what share of the demand in those ZIP codes went somewhere else. That is not a softened question. It is the same question at the resolution the public record supports.

200 or moremeasured cases
60–199measured cases
20–59measured cases
1–19measured cases
withhelda small cell — not zero

Lightness carries magnitude; outline style carries the epistemic state. The four measured classes are solid fills separated by 2.02, 2.03 and 1.69 in contrast (the ends by 6.9:1, which survives greyscale and colour-vision deficiency). The withheld class is no fill at all with a dashed outline — a difference in kind, not in shade. It is never rendered as 0, never smoothed, never interpolated, never modelled, and it reads suppressed in the detail card, in the popup and in the CSV export, where its case cell is empty.

Both shares are computed over measured demand only. The withheld tail belongs to neither share and is reported as withheld — so the denominator is a stated floor rather than a silent assumption.

How the record is assembled

Three sources. Three vintages. Never blended.

LaneSourceVintageWhat it can say
Capability — licensed to doCalifornia licensed-facility listingcurrent, read 2026-08-26What the site is permitted to offer
Activity — what it reported doingCMS Hospital Provider Cost ReportFY2023 final, published 2026-01-08What it filed, for a stated year
Origins — who depends on itCMS Hospital Service AreaCY2025, published 2026-07-06One payer's inpatients, by ZIP of residence
Beds per 10,000 of the catchmentno verifiable open ZIP-area population denominatorthree routes probed, all three failno estimate — never a zero

A licence says what a site is permitted to offer; a filing says what it did in a named year. The app shows both, labels both, and infers neither — and the gap between them is the most interesting thing on that side of the ledger.

The fourth row is the design decision worth stealing. SARA's headline density is inpatient beds per 10,000 population; the denominator does not exist at ZIP-area grain, so the cell renders the words no estimate with its citation and a button that shows all three failed probes. Zero is a measurement. Absence is not. An empty lane that states why is worth more than a modelled number that cannot be defended.

The application, first paint

A ledger you could photocopy, beside a map that explains it.
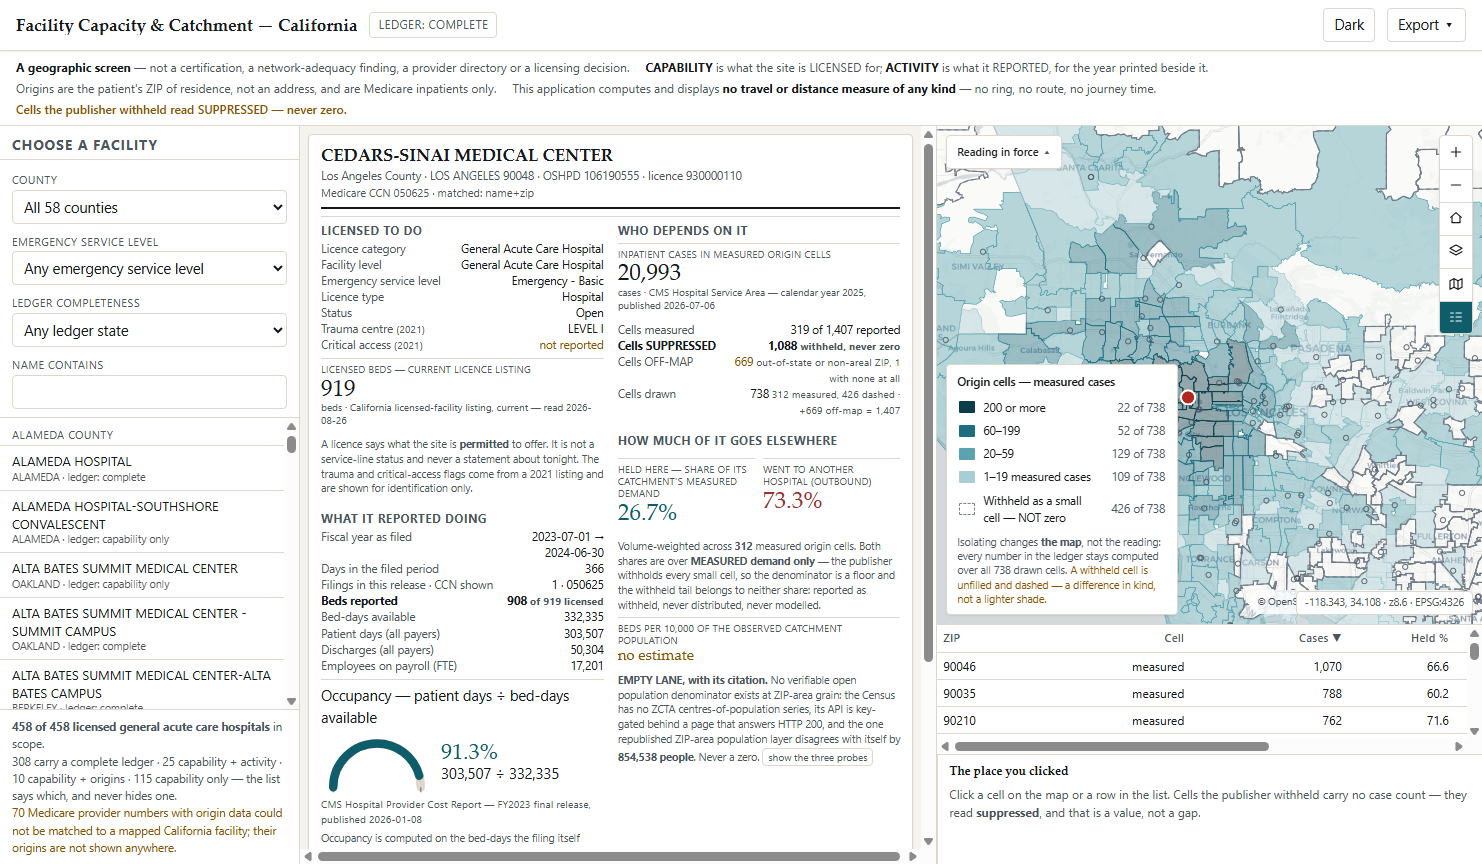
Facility Capacity & Catchment at first paint: the facility chooser at left, the two-column ledger for Cedars-Sinai Medical Center in the centre, and the origin-cell choropleth over Los Angeles at right with the legend and ZIP list.
Shipped build, 2026-08-26 — a browser screenshot taken by the automated driver, not a mock-up.
  • A boxed, printed-looking ledger. Two ruled columns and a provenance footer. No KPI wall, no rank, no chart rail, no scrolling story — the eye lands on a record.
  • The map is the ledger's illustration, framed rather than full-bleed: the ZIP areas that actually supplied this facility's patients, graduated by measured cases.
  • A persistent notice bar, never the status line: a geographic screen, not a certification; capability vs activity; no travel or distance measure of any kind.
  • Every number sits inside a ruled column with the year that produced it printed beside it. Lift a number out of this ledger and it loses its caption — which is the failure the shape exists to prevent.
  • Nothing on the page changes an assumption — only which facility is on the ledger. No threshold to drag, no scenario, no counterfactual.
The number that is new

The share that went somewhere else.

For each ZIP that materially depends on this facility, the share of that ZIP's measured demand the facility held — and the share that went elsewhere — rolled up to one facility-level figure, weighted by exactly what each origin contributes.

CEDARS-SINAI MEDICAL CENTER · Los Angeles County
licensed beds 919 · reported beds 908 — two measures, never one "capacity"
occupancy 303,507 ÷ 332,335 = 91.3 %
origin cells 1,407 → measured 319 · withheld 1,088 · off-map 669
= held 26.7 % · went elsewhere 73.3 %

And the two rows at the bottom of that ledger are the reading no incumbent screen produces. ZIP 90048 — the one the hospital sits in — it holds at 76.6 %. But 90019 and 90016 are among its largest origins and it holds barely a third of their measured demand: 33.4 % and 28.9 %. A facility drawing heavily from places where it is not the plurality provider is in a completely different position from one that is — at identical bed counts and identical occupancy.

CEDARS-SINAI MEDICAL CENTER
Los Angeles County · 90048 · OSHPD 106190555 · Medicare CCN 050625 · matched: name+zip

Licensed to do

Licence categoryGeneral Acute Care
Emergency service levelBasic
Trauma centre (2021)LEVEL I
919
Licensed beds — current licence listing

What it reported doing

Fiscal year filed2023-07 → 2024-06
Beds reported908 of 919
Patient days303,507
Discharges50,304
91.3 %
Occupancy — patient days ÷ bed-days available

Who depends on it

20,993
Inpatient cases in measured origin cells · CY2025
Cells measured319 of 1,407
Cells SUPPRESSED1,088
Cells OFF-MAP669
Cells drawn738

How much of it goes elsewhere

26.7 %
Held here
73.3 %
Went to another hospital
Beds per 10,000 of the catchmentno estimate
Both shares are over measured demand only — the publisher withholds every small cell, so the denominator is a floor and the withheld tail belongs to neither share.
The reading pane, as shipped. The whole record fits above the fold; only the provenance footer sits below it.
Why the disclosure floor is a design requirement, not a footnote

A rural hospital with almost no catchment — or twenty-six withheld cells?

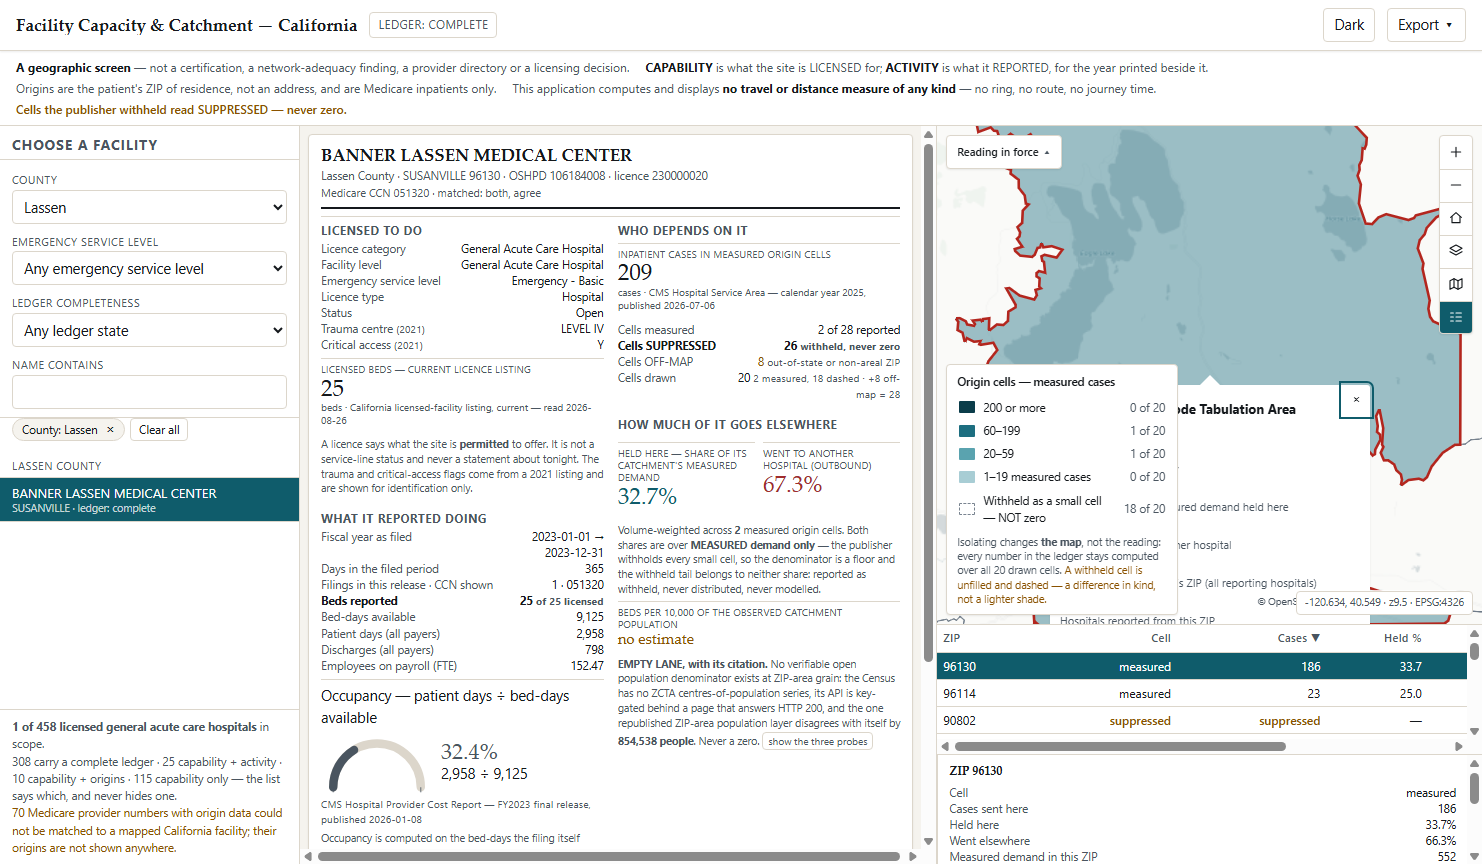
BANNER LASSEN MEDICAL CENTER — 25 licensed beds, 32.4 % occupancy, 209 measured cases. Twenty-six of its twenty-eight origin cells are withheld by the publisher.

2 measured · 18 withheld and drawn · 8 withheld and out of state, so undrawable on a California map. 2 + 18 + 8 = 28, and the app prints all three numbers separately rather than one that looks complete.

An application that rendered a withheld cell as zero would draw a rural hospital with almost no catchment. This one draws two filled cells and eighteen dashed outlines and says so — in the ledger, in the popup, in the ZIP list footer and in the CSV. The reading that survives is still substantive: a 25-bed hospital at a third of its occupancy, holding a third of its own town's measured demand. And it is honest about how little of the picture is visible.
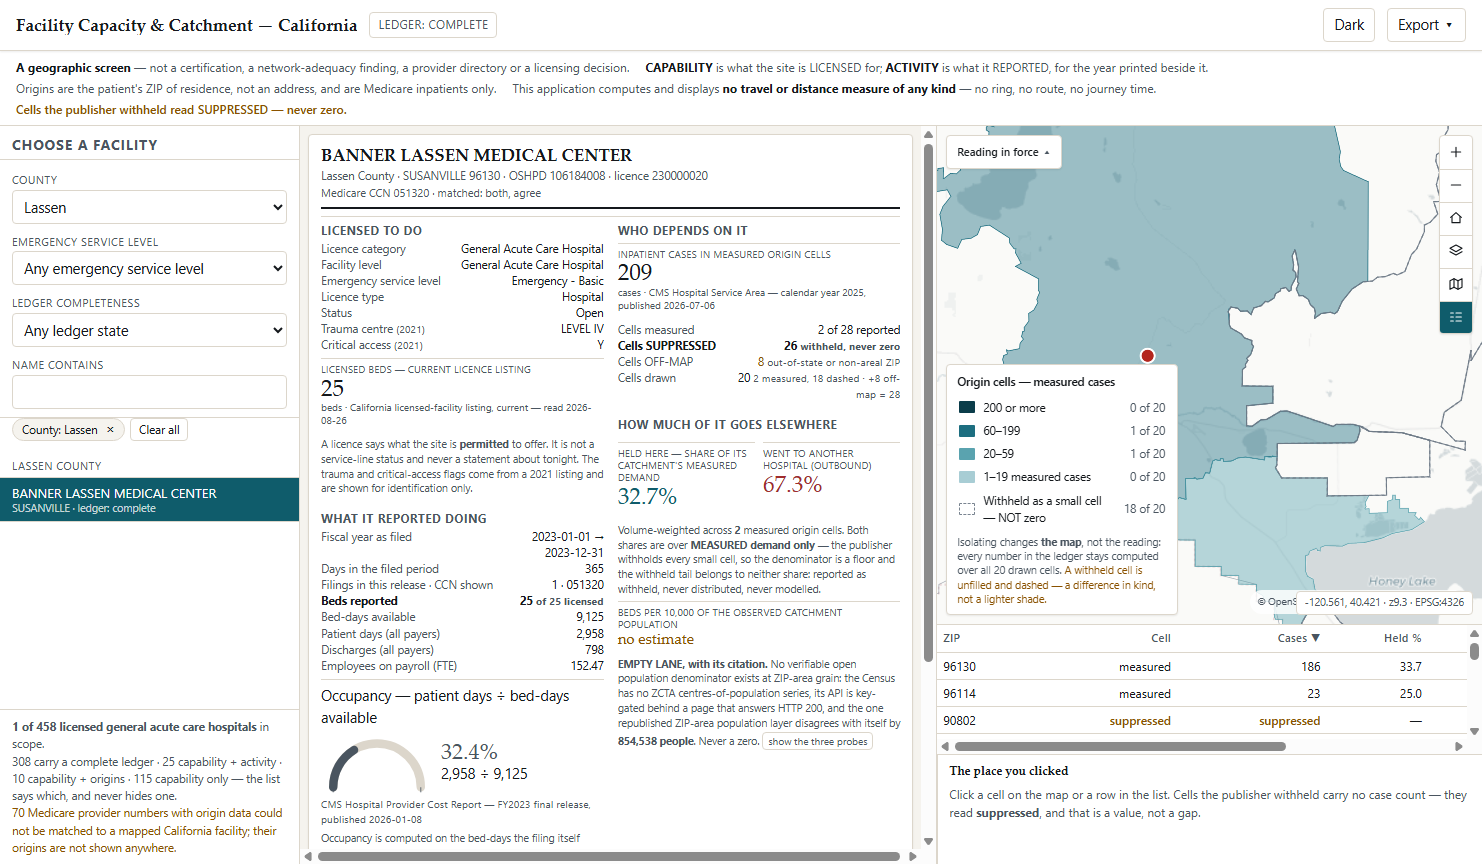
Banner Lassen Medical Center on the ledger: 2 measured cells, 26 suppressed, 8 off-map, 20 drawn — the map showing two filled cells and eighteen dashed outlines in rural north-east California.
The legend counts every class against the drawn total — 18 of 20 withheld — so the reader can see the shape of what is missing without being told a number that is not there.
The signature interaction

Bidirectional, or it does not ship.

A ZIP adopted: the row highlighted in the list, the map flown to that cell with its popup open, and the pinned detail filled with cases sent, held share and outbound share.
Click a ZIP row and the map flies to that cell, flashes it and opens its popup. Click a polygon on the map and the same pinned detail fills. Click the identity band and the map goes home from anywhere in the catchment. A second click on either side releases.

Pick a facility, and the whole record moves in one gesture — the identity band, the licensing schedule, the entire utilisation column, the occupancy gauge, both origin counts, both shares, the ZIP list and the map's catchment.

  • The legend filters the map and the list beside it — a real layer filter, not a fade — and says how many rows a hidden class costs.
  • Adopting a withheld cell reads suppressed in the detail and the popup. Never 0.
  • Esc unwinds one thing at a time: menu → drawer → isolate → hidden → selection → home → scope.
  • Three resizable panels, by pointer and by arrow keys, each clamped where its labels stay readable.
  • The deep link round-trips facility and scope, from a cold load.
47 behaviours specified and tested
Proof, not promises

Built, driven and measured — 2026-08-26.

658assertions green — 286 live · 220 offline · 152 in real headless Chrome
47behaviours specified, each mapped to the suite that exercises it
4.5the contrast floor — all twelve informational text states clear it in both light and dark, recomputed rather than eyeballed
458of 458 licensed acute hospitals listed — 308 with a complete ledger, and the list says which, and never hides one

The join is reported, not rounded

372 of 442 California provider numbers with origin data resolve to a mapped facility, by two independent routes. 221 agree · 1 disagrees · 1 is one-to-many — and both print verify on their face. The 70 that do not resolve are named in the chooser footer rather than quietly dropped.

The browser found what the other suites could not

A single glyphs: undefined invalidated the entire map style — the rejection reaches only the map.error event, and every non-visual assertion stayed green. The app now reports its own map errors to the status line; that handler found the bug within seconds of being added.

The on-prem posture is asserted from both ends

MapLibre is vendored, not fetched from a CDN. The browser suite records every outbound request Chrome actually made and allows only tile hosts. Point the basemap list at an internal tile server and the app makes no outbound request at all.

Three traps harvested for the library: the CMS data API silently truncates an over-large page — size=10000 returns 6,500 rows with no error and no flag, so a pager that stops when rows < size loses 94 % of the file. TIGERweb accepts maxAllowableOffset and it is worth 20× (1,000 features in 2 MB and 7.8 s, against 500 in 19 MB and 54 s). And a MapLibre expression may not compare a value to null — the throw is swallowed into map.error and the map silently stops updating.

Stated as boundaries, not caveats

What this application will not do.

  • A geographic screen, never a certification. Not a network-adequacy determination, not a provider directory, not an appointment or wait-time measure, and not a legal determination about a licence, a need or an entitlement.
  • No travel or distance measure of any kind. No isochrone, no drive-time ring, no "minutes to care". A catchment derived from observed origins says where the patients came from; it cannot say how long it took them.
  • Never patient-level data, under any framing — not de-identified, not sampled, not "just for the demo". A cell below the publisher's floor reads suppressed.
  • The catchment is one payer's inpatients. Medicare fee-for-service and Advantage claims, CY2025 — older and sicker than the whole population, and the app says so wherever the number appears.
  • Not a current-state monitor. It can say what a facility reported last year. It cannot say whether a unit is staffed tonight.
  • Capability is a licence, not a service-line status. The trauma and critical-access flags come from a 2021 listing and carry that vintage on their face.
  • Read-only, end to end. No write path anywhere, so it runs identically on Strata Serve and on ArcGIS.
  • English only, LTR throughout — a product decision, recorded as one rather than left as an omission.

Every one of these is written into the delivered application's own README, and the build records what it did not verify as plainly as what it did. A tool that hides its edges costs you the project it cannot finish.

Point it at your estate

One licensing schedule.
One origin aggregate.

Your licensed-facility inventory, your reported activity series, and an origin aggregate at facility × area grain with its disclosure floor named. Two weeks, and this ledger reads your estate instead of California's.

Portable by construction: both lanes in the reference build are national, the licensing vocabulary is a lookup rather than a hardcoded list, and a customer holding its own discharge extract behind its own perimeter can raise the resolution without changing the app's shape — because it consumes an aggregate schema either way. That is an ingestion path, not a rebuild.

tabaqat.net → Solutions → Health & Community info@tabaqat.net
© 2026 Tabaqat · Built on Strata. Reference implementation over California's 458 licensed general acute care hospitals. A geographic screen — not a certification, a network-adequacy finding or a licensing decision.
1 / 12