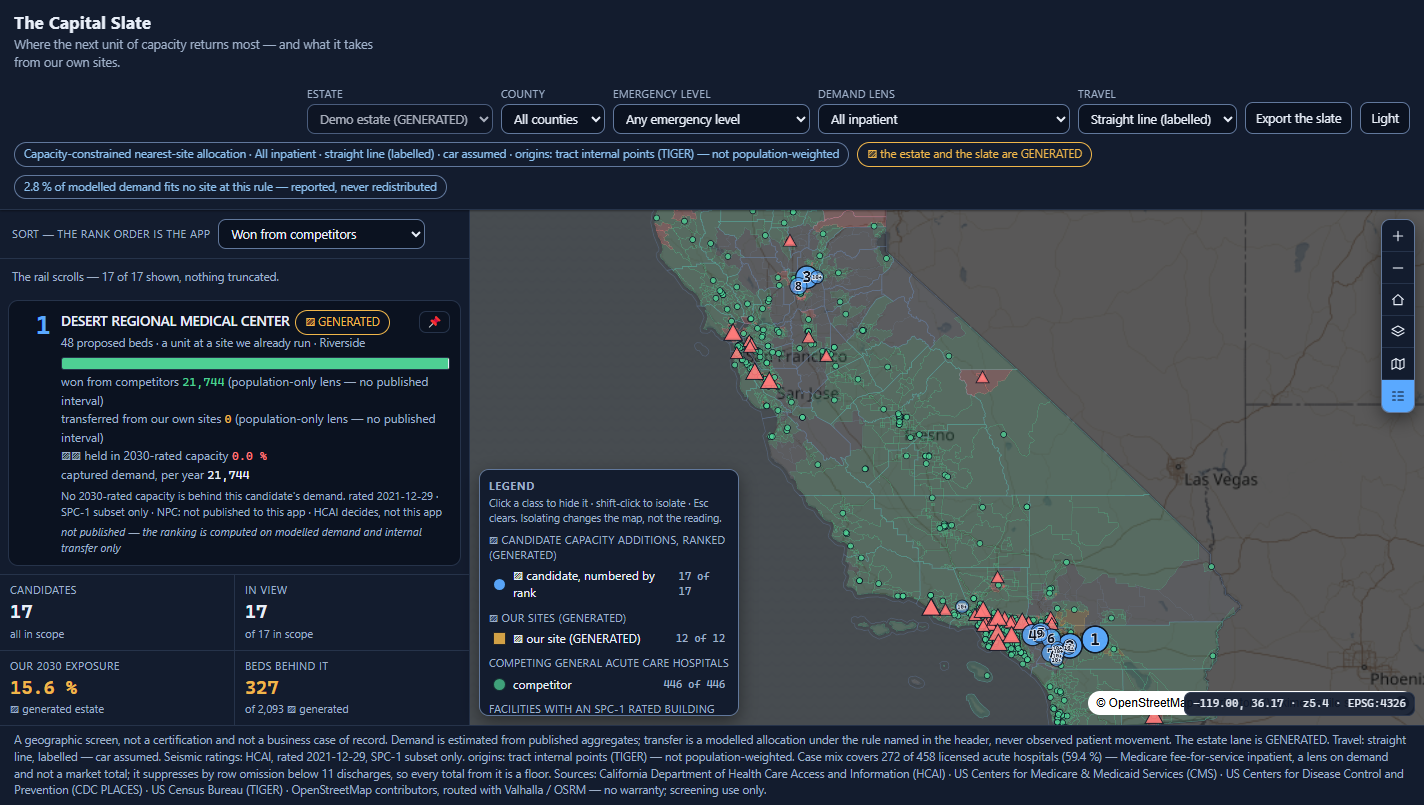
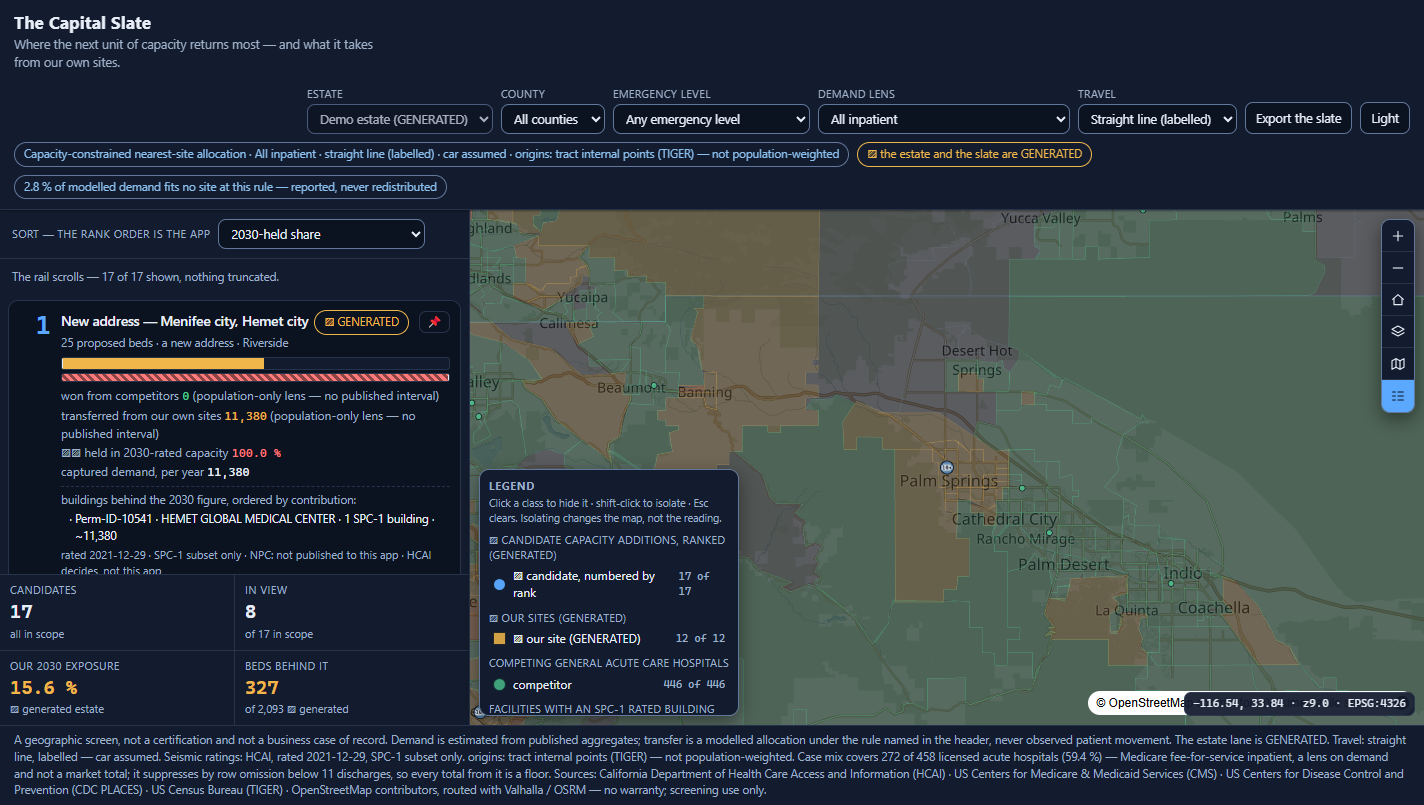
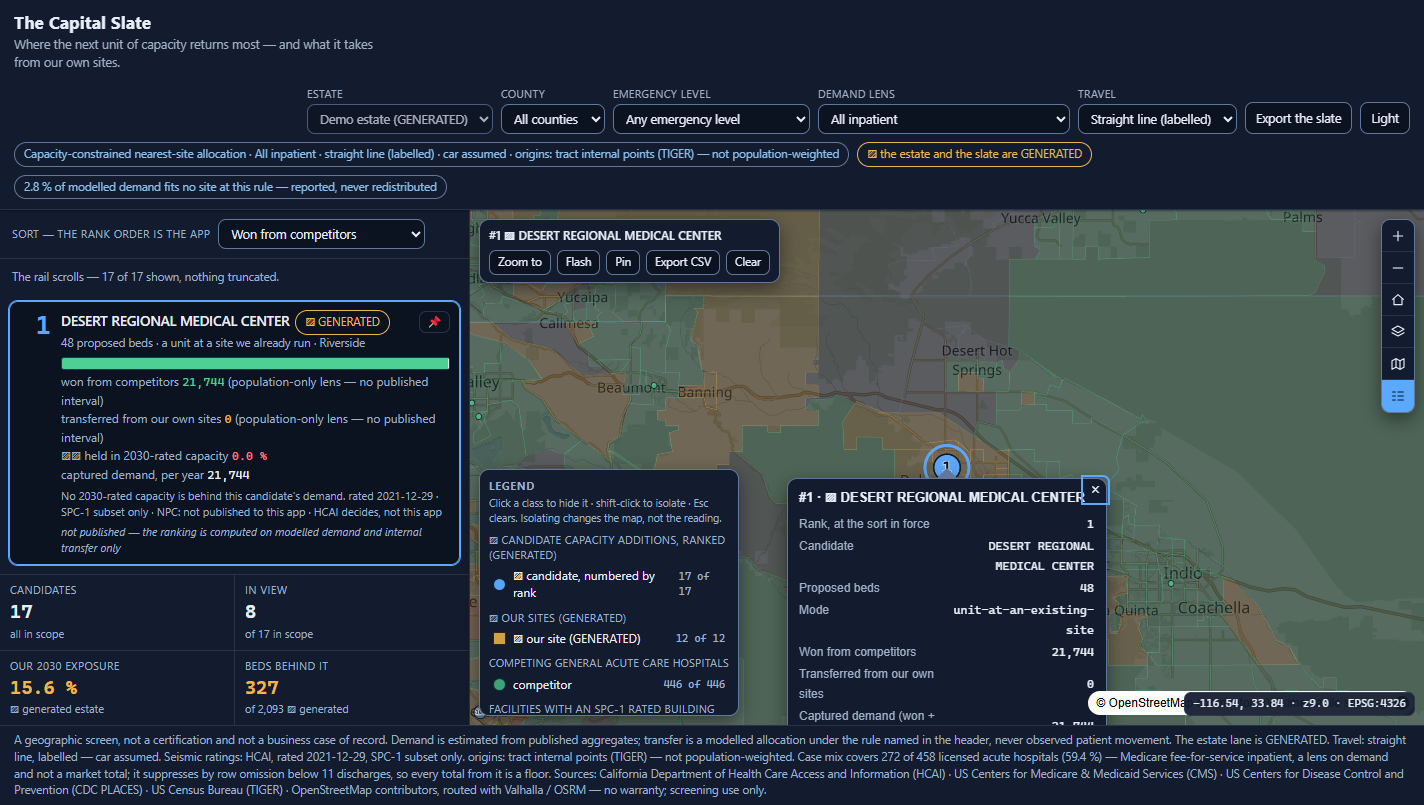
A ranked slate of candidate capacity additions, each one decomposed — beside a map that answers back. And the column nobody else in this market can compute: how much of that return sits in capacity a statute already removes on a published date.
Read at a capital committee, by a hospital-group strategy lead or CFO. The output is a ranked investment case with the internal trade-off named — not a facility dossier, and not a population count against a threshold. The rank order is the artefact the meeting argues over.
Which is why the rank order is the app: changing the sort renumbers the map, not just the list, because the rank lives on the record. A slate that reorders under a different reading of "return" is the point, not a glitch.
Ranked on demand won from competitors, rank 1 is a 48-bed unit at a site the group already runs — 21,744 of modelled annual demand, none of it taken from itself.
Re-sorted on the 2030-held share, a different candidate leads at 100 % — and it wins nothing at all. Same slate, same day.
There is no need-determination hearing to win in this market and no published bed-need formula an app could render as its governing rule. Roughly 35 states and DC still operate some form of CON; California is not one. A CON-shaped device here would model a rule that does not exist.
Health & Safety Code §130060: a building used for general acute care inpatient services after 1 January 2030 must meet the structural and nonstructural deadline requirements — or be retrofitted, replaced or converted to non-acute use.
The board is not choosing between expanding and standing still. It is choosing between expanding and being smaller in 2030 than it is now. RAND costed the statewide mandate at $34–143 bn, averaging over $92 m per building, with 34 % of hospitals already in financial distress.
The brief called this a siting problem. It is a replacement problem wearing a siting costume — and that is what put a statutory column on every card.
| Product | What it can say | What it cannot say |
|---|---|---|
| Sg2 / Vizient | The most authoritative demand curve in the market, by service line, out ten years | A forecast and an advisory relationship — not a ranked slate of places |
| Esri Business Analyst | Real site selection — drive-time trade areas, Huff allocation, Measure Cannibalization | That tool is geometric overlap only — no demand is allocated. And no regulatory state |
| Caliper Maptitude for Health Care | 5,428 hospitals with type, network and beds, plus HRSA service areas | A desktop mapping product with data attached — no ranking, no decomposition |
| Placer.ai · Trella · Definitive | Visits observed, referrals from real claims, the most complete provider directory | Footfall, claims and firmographics — no bed, no licence, no walls |
| HCAI's own seismic dashboard | The authoritative picture of which buildings are rated what | The state of an operator's walls — never the consequence for its market |
| The Capital Slate | Modelled demand, the internal transfer, and the published statutory fate of the buildings behind it — the join nobody else holds both sides of | Nothing about the 2030 term outside California — that rule has no analogue elsewhere |
Search for a product binding seismic compliance to capacity planning and you get construction cost consultants, structural engineers and real-estate advisors — and no health-market analytics vendor at all. The market analysts model demand and never look at the walls; the construction advisors cost the walls and never look at the demand.
Modelled demand currently allocated to another operator's site. This is growth. Every benchmark in the category does some version of it.
Modelled demand currently allocated to a site this group already runs. An internal reshuffle wearing a growth costume — and honestly, not unique: Huff allocation has decomposed capture this way for years.
NEW — and the least modelled term in the table. Demand sitting in a building whose published SPC rating is not 2030-compliant. The rating, the date and the services are published facts about buildings, not inferences about patients.
Displacement is a property of the incumbent building; ownership is a property of the incumbent operator. So every displaced unit is also either won or transferred — drawn as three segments it double-counts. It ships as two segments (won + transferred = captured, asserted exact to 1e-6) plus a cross-cutting hatch band for the 2030 share, on its own rail.
What fraction of a candidate's captured demand sits in capacity that state law removes on a published date — with the buildings behind it named, ordered by demand actually donated.
It turns a market question into a capital question with a deadline on it. A candidate whose demand is mostly won is growth. Mostly transferred, and it is an internal reshuffle. Mostly 2030-held — and it is not an addition at all.
And the app says who decides: HCAI. It renders a published rating and a statutory date. It never asserts that a building will close.
Four sorts, each a different reading of "return": won from competitors · total captured · 2030-held share · transferred from our own sites.
The outbound half — row to map — is what every viewer in this shape ships. The inbound half is the one they skip, and without it the map is a picture rather than a partner.
The CCN bridge joins zero rows naively — one publisher, two spellings. It resolves 268 of 272 after zero-padding; the four residuals are carried as unresolved, never dropped. The SPC join resolves 40 of 43; the three that left the licence register keep their own class.
One returns the real map with "API KEY REQUIRED" composited over every tile; the other a fixed "418 · Access blocked" image. Both pass a URL check, a !key= check and a naturalWidth>1 check. A screenshot is what caught it.
The rank numerals — the app's whole signature — validated, added, threw nothing and drew nothing. Fixing that broke the entire layer silently: a data-driven icon-image fails in the tile worker with a clean console. Now rasterised to canvas icons, one symbol layer per class.
Reading the figures: the supply register, the seismic ratings, the tract geography, the prevalence estimates and the case mix are real, published and re-probed on 2026-08-26. The estate and the candidate slate are GENERATED (seed 20260826) under four conditions that all hold — and are labelled ▨ GENERATED on every card, in the legend, in the KPI block and in every export. No generated figure is ever summed into a measured one.
Every one of these is written into the delivered application's own README. A tool that hides its edges costs you the project it cannot finish.
Your real estate in place of the generated one, your candidate additions with their proposed bed counts, and the rule that gates capacity in your jurisdiction. Two weeks, and this slate ranks your capital plan instead of a demonstration.
Swappable by configuration, not by code: the supply register, the demand geography, the prevalence lens and the statutory column. The three-term decomposition is a typology the app renders — not a list of California numbers it ships.