__MK__tabaqat · StrataHealth & Community
Break First — Public Health Preparedness

Where does the health system
break first?

A surge of a size you choose, arriving in a jurisdiction you choose. Operational Areas ranked by the share of their population whose nearest emergency-capable hospital the scenario disqualifies — and the named sites that cause each break.

California reference implementation · 9,109 tracts · 332 ED-capable sites · 537 assertions green A planning clock, not an incident clock
© 2026 Tabaqat · Built on Strata — sovereign geospatial applications. Every figure is computed from published regulator data; no lane in this application is generated. Licensed and rated is not staffed and open.
The decision this drives

Pre-position, resource, or write the mutual-aid annex.

Three named acts, each with a rule behind it. Where the cache and the alternate-care-site plan go. Who the receiving partners are when a site is limited or ceases operating — the § 482.15(b)(7) arrangement. And the community half of every member hospital's risk assessment, the § 482.15(a)(1) community-based all-hazards assessment no single facility can author for itself.

It is read before anything happens, in a planning meeting, against a scenario the analyst picks. A planning clock, not an incident clock — and that distinction is the product. There is no incident, no feed, and nothing on this board that ages.

Buyer: county or state public-health preparedness lead Reads over the shoulder: the MHOAC · the coalition convenor · CDPH / Cal OES ESF-8
11.26 %of Californians — 4,430,506 people — live in a tract whose nearest ED-capable licensed hospital carries at least one building the state itself rates SPC-1

48.09 % of them are in a top-quartile-SVI tract. 35 of 332 ED-capable sites are disqualified; 10,100 of 72,826 licensed beds come out; 22 of 58 Operational Areas are exposed.

Change the rule or the surge posture and every one of those numbers moves in one frame.

The finding that shaped the app

There is no “NIMS health annex,” and the live-status board is already bought.

NIMS is a management system

Not a scoring rule, and there is no document by that name. What governs is ESF-8, Public Health and Medical Services — and, in California, H&SC § 1797.153, which names the buyer (the MHOAC) and names the deliverable.

The live-status question is owned

The incumbent claims 4,000+ client organisations across all fifty states for real-time bed, ventilator and diversion status. It answers “what is free right now.” A thin version of it would have been the worst available outcome.

So the app asks “what if,” not “what now”

Re-scoped to a pre-incident screen over licensed and rated attributes — already published, already verified. Which means the app needs no live feed at all, and has no generated headline lane.

The re-scope is the ruling. Building on published licensed and rated attributes is not a compromise on the original brief — it is the strongest data position this category could take.

The alternative was a headline lane of generated live bed status. In public health, a generated indicator is indistinguishable from a fabricated public-health claim. Nothing in this application is generated.

Four product families were opened. Each stops in the same place.

The rule and the geography live in different tools.

What was openedWhat it doesWhere it stops
ASPR TRACIE Surge EstimatorThe federal method for a coalition surge number — an .xlsm each hospital fills inThe rule, with no geography and no denominator
HHS emPOWER MapAt-risk, electricity-dependent Medicare totals, monthly, with hazard overlaysThe demand side, with no supply side — and at ZIP, not tract
The regulator's own atlasHover a bar, see where the SPC-1…SPC-5 buildings are, 2001–2021A compliance-progress chart with a locator map — no population
The live-status platformReal-time beds, ventilators, PPE, EMS diversion, facility status“Now,” never “if” — and already licensed by the buyer
PACER hospital surge simulatorSimulates one hospital's strategies by archetype; published 30–40 % of staffed bedsA model, one facility at a time, explicitly aspatial
Break FirstJoins a licensed, rated capability record to a population denominator under a chosen scenarioThe join nobody else makes

The framework tools carry the rule but no geography. The mapping tools carry the geography but no rule. The commercial platform carries now but never if. Nobody joins a rated capability to who depends on it.

And the sales motion follows from one market fact: the federal surge estimate is assembled from hospital self-report. This is not a competitor to that spreadsheet — it is what a planner opens before sending it, and what shows them whose returns are missing.

Why this is computable rather than aspirational

The verdict is the regulator's own statutory rating — not a threshold we invented.

The rating decides it

The Alquist Act as amended by SB 1953 assigns every acute-care hospital building an SPC rating, 1 to 5. SPC-1 may be at risk of collapse; by 1 Jan 2030 buildings must be capable of providing services after a strong earthquake. The rule-maker already ruled.

The capability is a licence, not a label

Title 22 § 70411 defines Basic emergency service as an area “staffed and equipped at all times”; Comprehensive and Standby are separately defined licensed levels. A break point computed on a regulatory status is defensible. One computed on a bed guess is not.

The obligation is federal

42 CFR § 482.15(a)(3) pairs persons at-risk with the services the hospital can provide. That pairing is this app's unit of answer, written into federal law — which is why the product is the join, not the map.

exposednearest qualifying site is disqualified by the rule in force
high-SVI exposedexposed and in a top-quartile-vulnerability tract
not exposedunder this scenario only — never called “safe”
no estimatea hatch, labelled in words — never a shade, never 0

“No estimate” is a hatch, not a shade, because a shade of the ramp reads as a low value. A suppressed or unmodelled tract stays a reachable row in the table and in the export, reading the words “no estimate.” No data colour is ever used as text — measured, not assumed: not one of the six clears 4.5:1 on both grounds.

The application, first paint

The scenario, the break, and who is behind it — on one board.
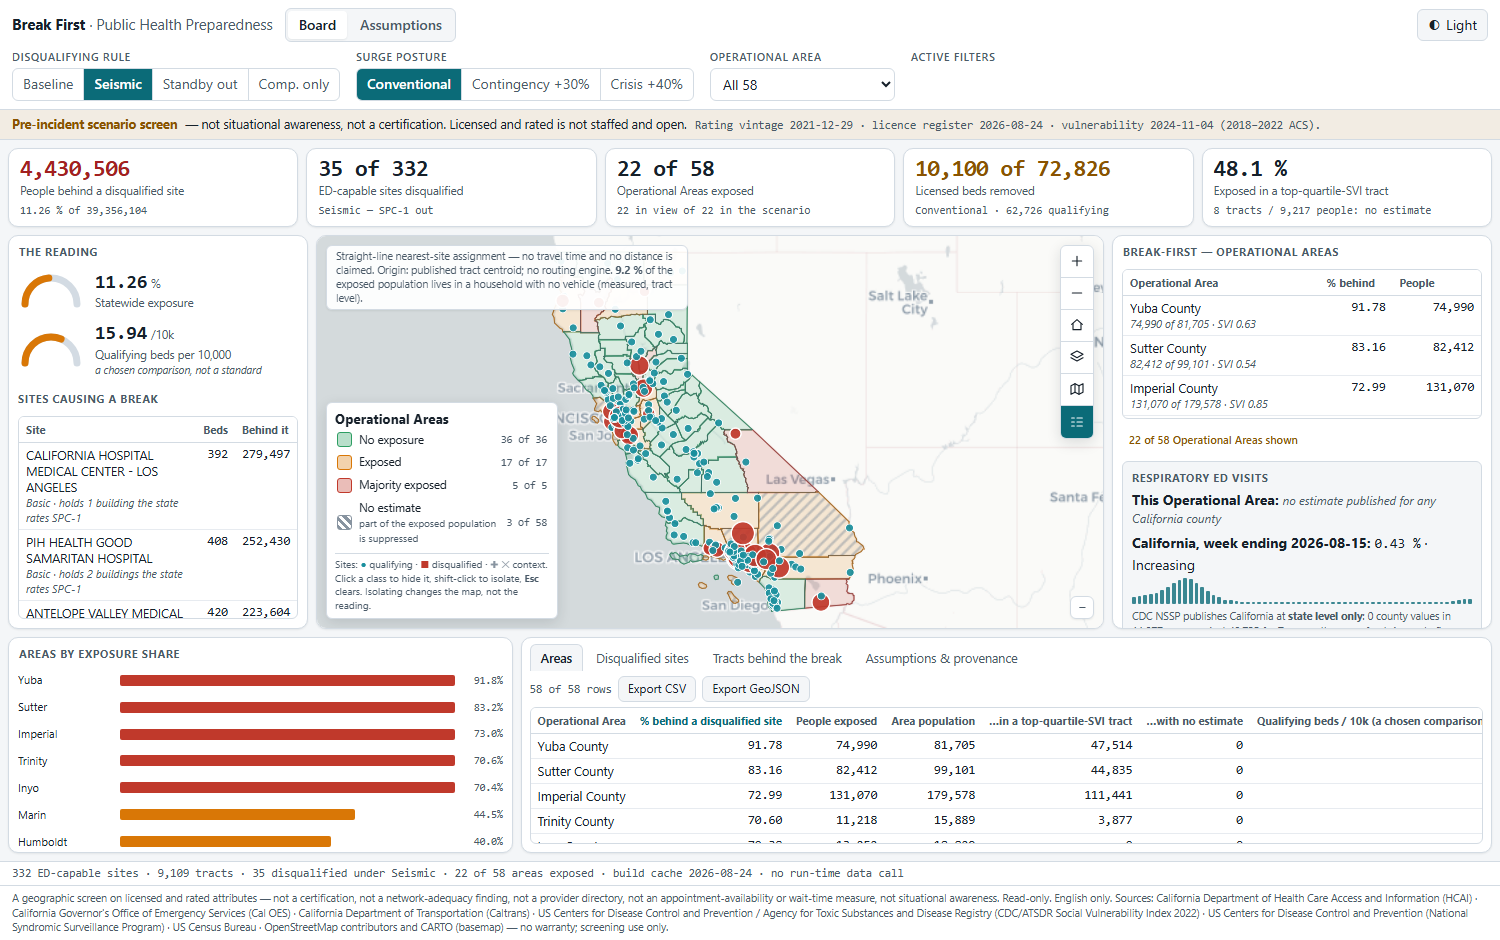
Break First at first paint: the scenario selectors in the header, a full-width KPI strip, the gauge and site column at left, the boxed California map at centre, and the break-first list at right.
Shipped build, 2026-08-25 — a browser screenshot taken by the automated driver, not a mock-up.
  • The scenario, in the header. A disqualifying rule and a surge posture. Everything below recomputes; nothing moves unless the analyst moves it.
  • A persistent notice bar. Licensed and rated is not staffed and open · the 2021 rating vintage · the straight-line assignment. Never the status line, which is transient.
  • The break-first list. Operational Areas ordered by the share of their population behind a disqualified site — not by bed rate, which is unstable on a small denominator.
  • The legend filters the source, not the paint — a hidden feature cannot be clicked through. Rows keep n of N, always.
  • A tab stack that carries the argument. Areas · Disqualified sites · Tracts behind the break · Assumptions & provenance, printable.
Light theme, deliberately — a planning meeting, not a wall
The number that is new

Rated capability at risk, with its population denominator.

Not “43 buildings are rated SPC-1,” and not “this county is vulnerable,” but the share of an area's population whose nearest qualifying emergency capability sits at a site the scenario disqualifies — and the named sites that cause it.

9,109 tracts, each assigned to its nearest ED-capable licensed site
332 ED-capable open sites · 35 carry at least one SPC-1 building
licensed beds 72,826 → qualifying 62,726 · removed 10,100
population behind a disqualified nearest site 4,430,506 of 39,356,104 = 11.26 %
of the exposed, in a top-quartile-SVI tract 2,130,734 = 48.09 %
aged 65+ among the exposed 644,708 · no-vehicle households 9.18 %

The regulator supplies the verdict; we supply the denominator. No benchmark emits this: the regulator publishes the rating with no population, the federal at-risk map publishes the population with no capability, the vulnerability index publishes vulnerability with no supply at all.

Break first22 of 58 exposed · seismic rule
1YUBA COUNTY91.78 % ■ EXPOSED · 74,990 of 81,705 people
47,514 of them in a top-quartile-SVI tract · caused by Adventist Health and Rideout, 221 beds, 1 SPC-1
2SUTTER COUNTY83.16 % 82,412 of 99,101 · 44,835 high-SVI — the same site, across the river
3IMPERIAL COUNTY72.99 % 131,070 of 179,578 · 111,441 high-SVI · El Centro Regional, 5 SPC-1 buildings
4TRINITY COUNTY … 18 more exposed · 36 Operational Areas at zero under this scenario
Los Angeles ranks 10th at 19.58 % — and carries 1,945,506 exposed people, the largest count in the state.
The ordering is exposure share, which needs no invented line. Ordering by beds per 10,000 would put Modoc — 141.02, off a population of 8,651 and no hospital of its own — at the top of a list of California's best-resourced counties. That gauge is on screen, labelled “a chosen comparison, not a standard,” and nothing is ever ordered by it.
The signature interaction

Click the break, and the app names what caused it.
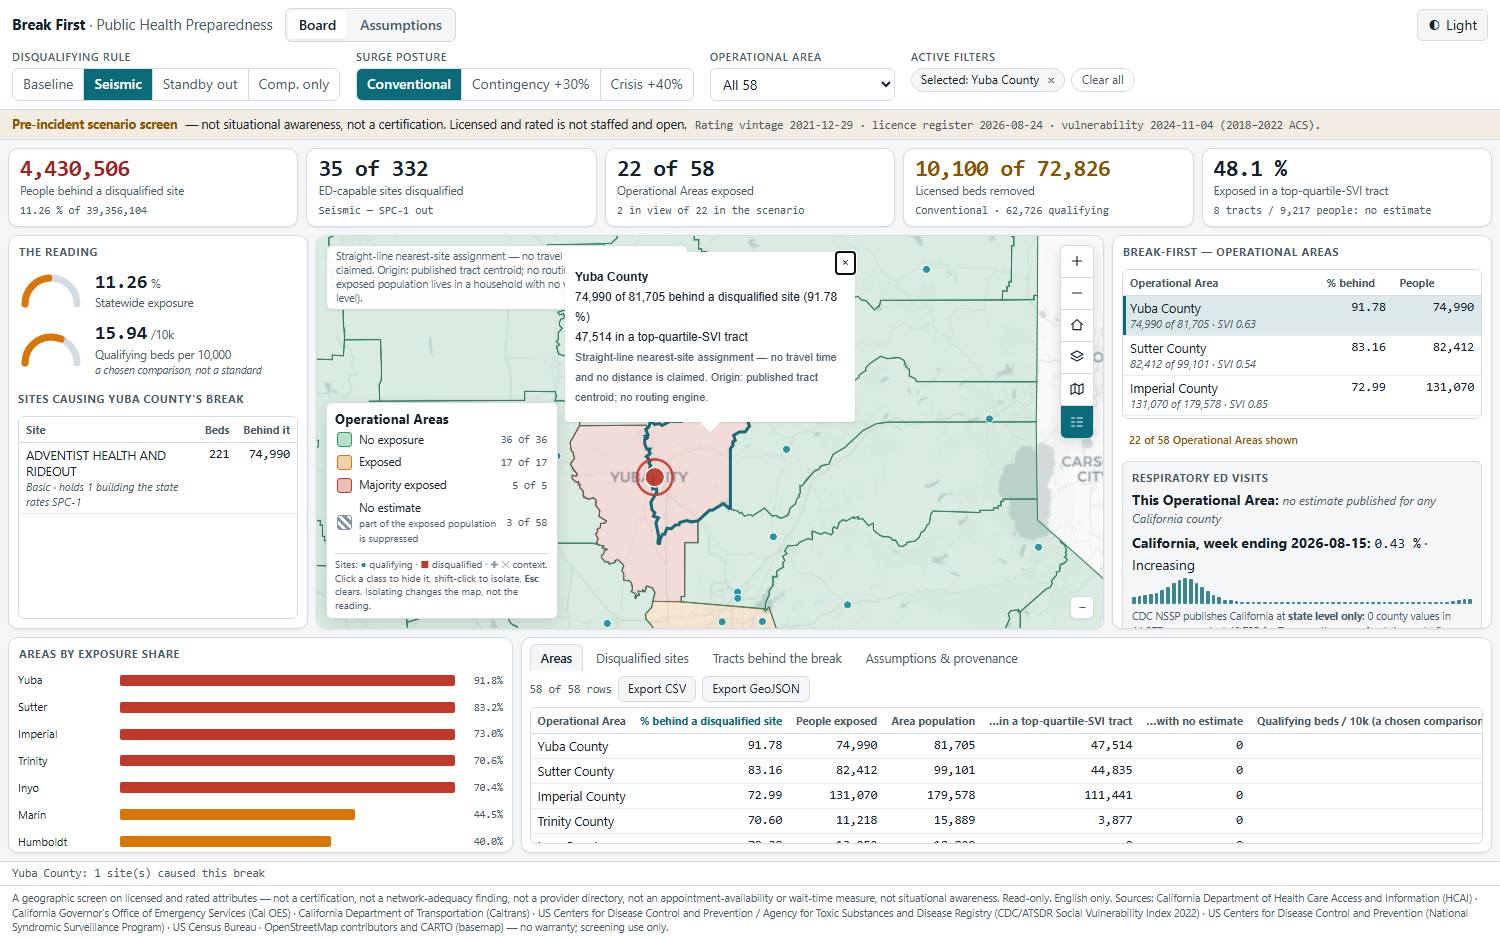
Yuba County adopted: the break-first row highlighted, the map flown to the Operational Area with its popup open, the causing sites flashed, and the site column re-titled to that area.
Adopt the rank-1 row and the map flies to that Operational Area, flashes the sites that caused its break, re-titles the site column, and opens the area's record with both denominators. Click a county on the map and the list scrolls that row into view. A second click on either side releases everything.

The outbound half — row to map — is what every board in this shape ships. The inbound half is the one they skip, and without it the map is a picture rather than a partner.

  • The scenario — rule × posture; KPIs, gauges, map, list, chart and table all recompute in one frame, and it deep-links.
  • The extent — panning recomputes n in view of N in the scenario. Never a bare count.
  • The legend — filters the map and the list, and says in words that isolating changes what is shown, not the reading.
  • Every active filter is a labelled chip with an ×, plus Clear all. Esc unwinds one thing at a time.
44 behaviours specified and tested
The scenario is load-bearing, and it is honest about itself

Twelve readings. One in force at a time.

RulePostureBeds /10kQualifyingBelow the line
BaselineConventional18.5072,82640 of 58
Seismic (SPC-1 out)Conventional15.9462,72638 of 58
Seismic (SPC-1 out)Crisis +40 %22.3187,81638 of 58
Standby outConventional18.1371,33745 of 58
Comprehensive onlyConventional1.184,64014 of 58

The posture scales supply; it never touches the rating. A surge posture is an assumption about how much capacity can be stood up — conventional, contingency +30 %, crisis +40 %. It cannot make an SPC-1 building safe, and the app never lets it.
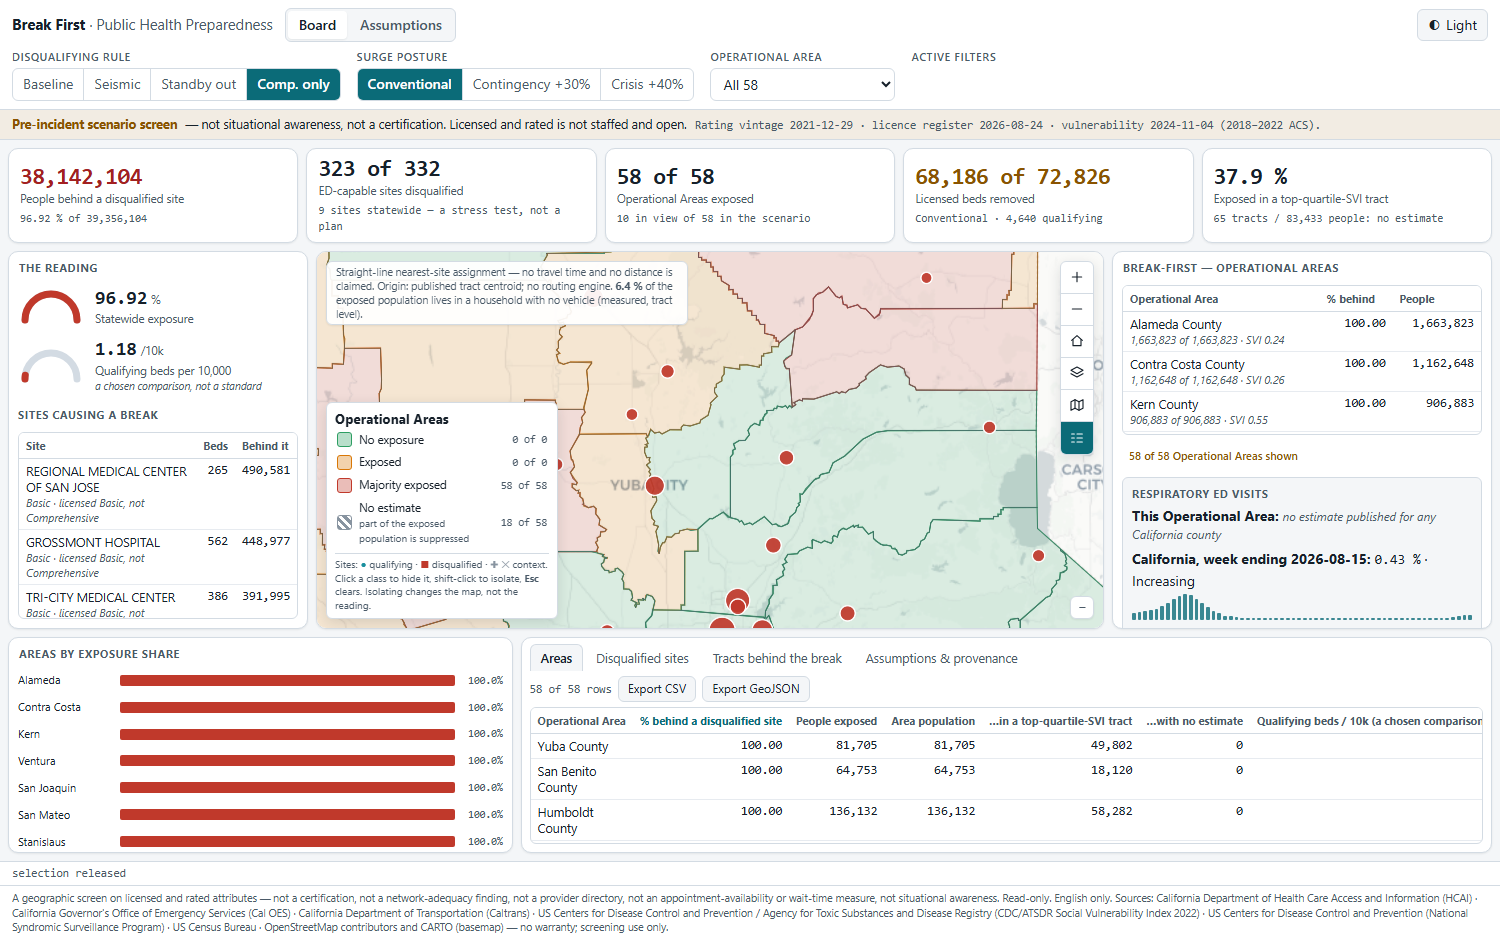
The comprehensive-only scenario, labelled on screen as nine sites statewide, a stress test and not a plan.
Under comprehensive-only the statewide qualifying rate collapses to 1.18 beds per 10,000 across 9 hospitals. That is not a finding about California's capacity — it is what happens when a screen is run against the narrowest licensed category.

So the app says so, on screen

The scenario labels itself “9 sites statewide — a stress test, not a plan.” A reading that can be mistaken for a capacity statement has to refuse the mistake in words, in the place the mistake would be made.

Proof, not promises

Built, driven and measured — 2026-08-25.

537assertions green — 233 live · 191 offline · 113 in real headless Chrome
44behaviours specified, each mapped to the suite that exercises it
5.72worst informational contrast ratio across both modes and both grounds — the floor is 4.5
0run-time data calls — measured from the browser's own network log, not claimed in prose

The contrast is computed, not eyeballed

The offline suite parses the token blocks out of the shipped index.html and computes WCAG relative luminance for all eight roles against both grounds in both modes — and proves the premise that no data colour may be used as text.

Sovereignty is measured

Chrome's DevTools protocol records every request and judges it. Not one reaches any of the seven bound data hosts. Two deliberate egresses remain — keyless basemap tiles and a version-pinned MapLibre — and both are named, with the vendoring step written down.

A screenshot found what green suites could not

The area popup was opening underneath the map chrome, hiding its first line. Every suite was green. One look at the render made it obvious — and the fix is now hit-tested at the popup's first pixel, not merely checked for overlap.

Reading the figures: every number on the face of this application is computed from published regulator sources — the licensed-facility register, the statutory SPC ratings, the vulnerability index and tract population — and asserted against the recipe's literal probe output. No lane is generated. The seismic rating is a 2021-12-29 snapshot, printed as its vintage in the notice bar, because the refreshed authoritative CSV 403s every machine fetch.

Stated as boundaries, not caveats

What this application will not do.

  • Licensed and rated is not staffed and open. The limit a hospital will challenge first, carried in the notice bar on every screen. Anyone who needs staffed and open needs the live platform they already licence.
  • Not situational awareness. No live bed or staffing status in any form — not synthetic, not “empty but planned.” The incident clock belongs to another product.
  • No travel time and no distance, anywhere. A labelled straight-line nearest-site assignment. Travel time needs a router inside the customer's perimeter — a public router receiving a health organisation's geography is a security finding.
  • Never patient-level. The finest grain anywhere in the app or any export is a census tract, asserted. No casualty forecast.
  • Read-only, end to end. No write path, no per-feature edit, no queue, no survey. It runs identically on either backend because it writes to neither.
  • Not a certification. Not a network-adequacy finding, not a provider directory, not an appointment or wait-time measure.
  • An empty lane stays empty. California publishes no county-level surveillance value at all — 11,774 of 11,977 rows read Data Unavailable. That slot renders empty with its citation, naming CalSyS / ESSENCE as what fills it behind your perimeter.
  • Outside California the product degrades. The per-building operability rating exists because California alone legislated it. Elsewhere this falls back to licensed emergency-service level against hazard and population. Any claim of national parity would be false.

Every one of these is written into the delivered application's own README. A tool that hides its edges costs you the project it cannot finish.

Point it at your jurisdiction

One licence register.
One population denominator.

Your licensed-facility inventory with its emergency-service levels, your operability or condition rating if your state issues one, your tract populations and vulnerability index, and an owner for the scenario assumptions. Two weeks, and this board reads your Operational Areas.

Swappable by configuration, not by code: the reporting geography, the capability field and its licensed levels, the disqualifying rules and the surge postures. No threshold or label is hardcoded to a California rule — the rating join is a typology the app renders, and where no rating exists the app says so rather than inventing one.

tabaqat.net → Solutions → Health & Community info@tabaqat.net
© 2026 Tabaqat · Built on Strata. Reference implementation over California Operational Areas; every figure computed from published regulator sources, seismic ratings vintage 2021-12-29. A pre-incident planning screen — not a certification, not situational awareness, and never patient-level.
1 / 12