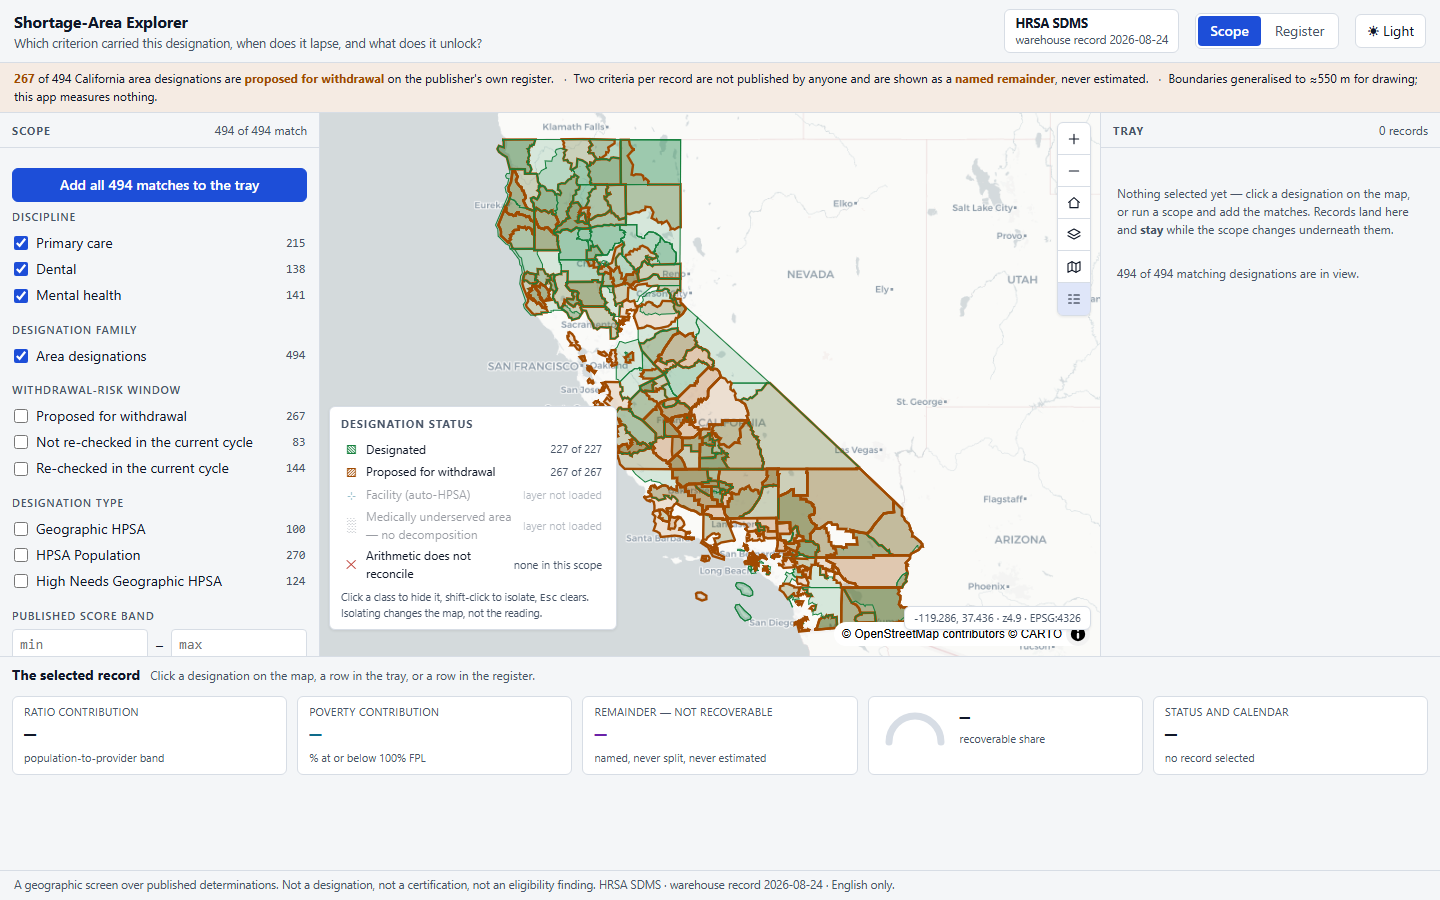
The designation authority publishes that a place scores 18. Nobody publishes what the 18 is made of. This app recomputes every point it can from the published rule, and names — never estimates — the part that no public dataset can recover.
And then to assemble the evidence register that goes with the filing — a placement, health-centre eligibility, a Medicare bonus, a state loan-repayment claim. That read happens on the designation and grant calendar: at re-designation, at a funding deadline, and in the weeks after a national update lands. Not continuously, at planning time.
Which is why the unit of answer is a designation record — which criterion carried it, by how much, what state it is in on the statutory calendar — and never a population count against a movable threshold. That is a different product, for a different buyer, on a different clock.
The widely-bound republication of the same register shows zero. Same federal data, one copy behind — and the copy is the one most maps are built on.
The effective date of a withdrawal is the next Federal Register notice. The authority has said it intends to resolve this cohort on or before 1 July 2027.
The published record carries a withdrawal date. It is NULL on 100 % of California rows — because a withdrawn designation is removed from the set rather than flagged in it. A date-range picker over that field is a control over nothing.
It is answered by status + staleness on a statutory calendar: the published status, how long since the record was last touched, the September 2025 national update, and the next annual Federal Register notice.
A national update re-applies standardised data to every existing designation and re-checks it. In one state's published 2017 impact analysis of 526 designations: 222 scores rose, 157 fell, 48 held, and 98 went into jeopardy.
The brief this app was built from asked "when does it lapse". Inventing an expiry field to answer it would have been the one defect this product cannot survive — so the app answers the question and corrects its premise on the same screen.
| Publication | California rows | Proposed for withdrawal | Bound? |
|---|---|---|---|
| The widely-mirrored republication | 180 primary-care rows, every one Designated | 0 — the status field is there, and it is stale | Off, as a labelled comparison |
| The designation authority's own server | 215 primary care آ· 138 dental آ· 141 mental health — one row per designation | 123 آ· 45 آ· 99 = 267 of 494 | Bound. Every figure in the app comes from here |
| The component-boundary layers most tools count | 1,131 dental rows آ· 2,363 mental-health rows | — they are 93 and 135 designations, sliced; up to 110 rows for one | Not bound — a row count is a geometry count |
Three legitimate readings of one register: 0 in jeopardy, 267 in jeopardy, or 3,494 "designations" that are really 494. A designation figure quoted without naming which publication produced it is not reproducible — and an evidence register built on the wrong one is wrong in the direction that costs the customer the designation.
So the publication and its warehouse date sit in the header, in the notice bar, in every popup and in the export's provenance block. It is provenance, not navigation.
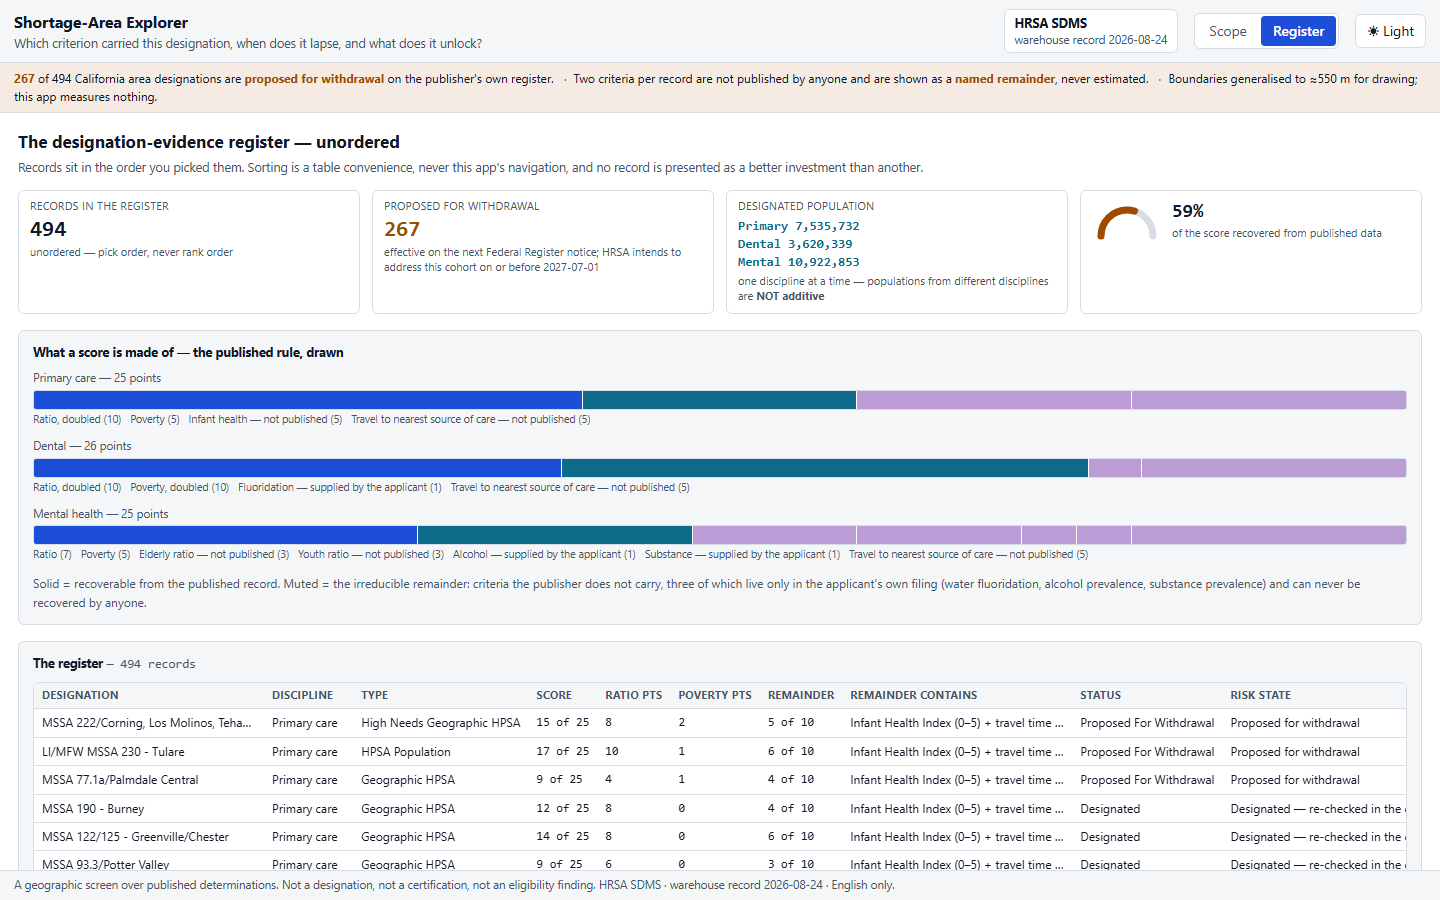
| Discipline | Scale | Recoverable | The named remainder |
|---|---|---|---|
| Dental | 0–26 | up to 20 آ· 66.3 % | 0–6 — fluoridation + travel |
| Primary care | 0–25 | up to 15 آ· 64.2 % | 0–10 — infant health + travel |
| Mental health | 0–25 | up to 12 آ· 45.3 % | up to 13 — elderly, youth, alcohol, substance + travel |
| Facility (automatic) designations | score published | 0 of 1,423 rows carry either input | the whole score is remainder — designated by statute, not by the score |
The app is more useful about teeth than about psychiatry, and it says so on the face of every record. That asymmetry is counter-intuitive, it is a property of what the authority publishes, and smoothing it into one confident ramp would be the lie.
There is therefore no single correct colour ramp in this app, so the map does not use one. Dental runs 0–26 where the other two run 0–25, and the medically-underserved index runs the other way. The map paints by status; the score appears as a number with its scale printed beside it.
A designation dashboard, two find-by-attribute tools with status and update-date filters, find-by-address, batch processing of up to 200 addresses, a Medicare bonus eligibility analyzer, quick maps and a map gallery. XLSX, CSV and SHP downloads, plus quarterly PDF summaries. Selecting and exporting shortage areas is a solved and free problem.
The boundaries ship as a foundational layer in the major GIS content catalogue. A commercial indicator platform carries the medically-underserved index, refreshed quarterly. Both render the number. Neither decomposes it, and neither carries the withdrawal calendar.
A state office spreadsheet and a PDF. Verified across several states. None decomposes a score; none renders the calendar as a state. And the health-centre planning tool this buyer already uses carries designations as optional context layers, under a different subject entirely.
Nothing in the sweep decomposes a score — and the reason is now understood rather than assumed. The components are not in the published data. Any tool built by reading the published data cannot show them. They have to be reconstructed against the published rule, and the part that cannot be reconstructed has to be named. That is the whole product, and it is one honest step nobody has taken.
So the pitch is never "scope and export shortage areas" — that would have no product. It is what happens between the selection and the export: the decomposition, the named remainder, the withdrawal state read against the statutory calendar, and all three travelling into the exported register as evidence.
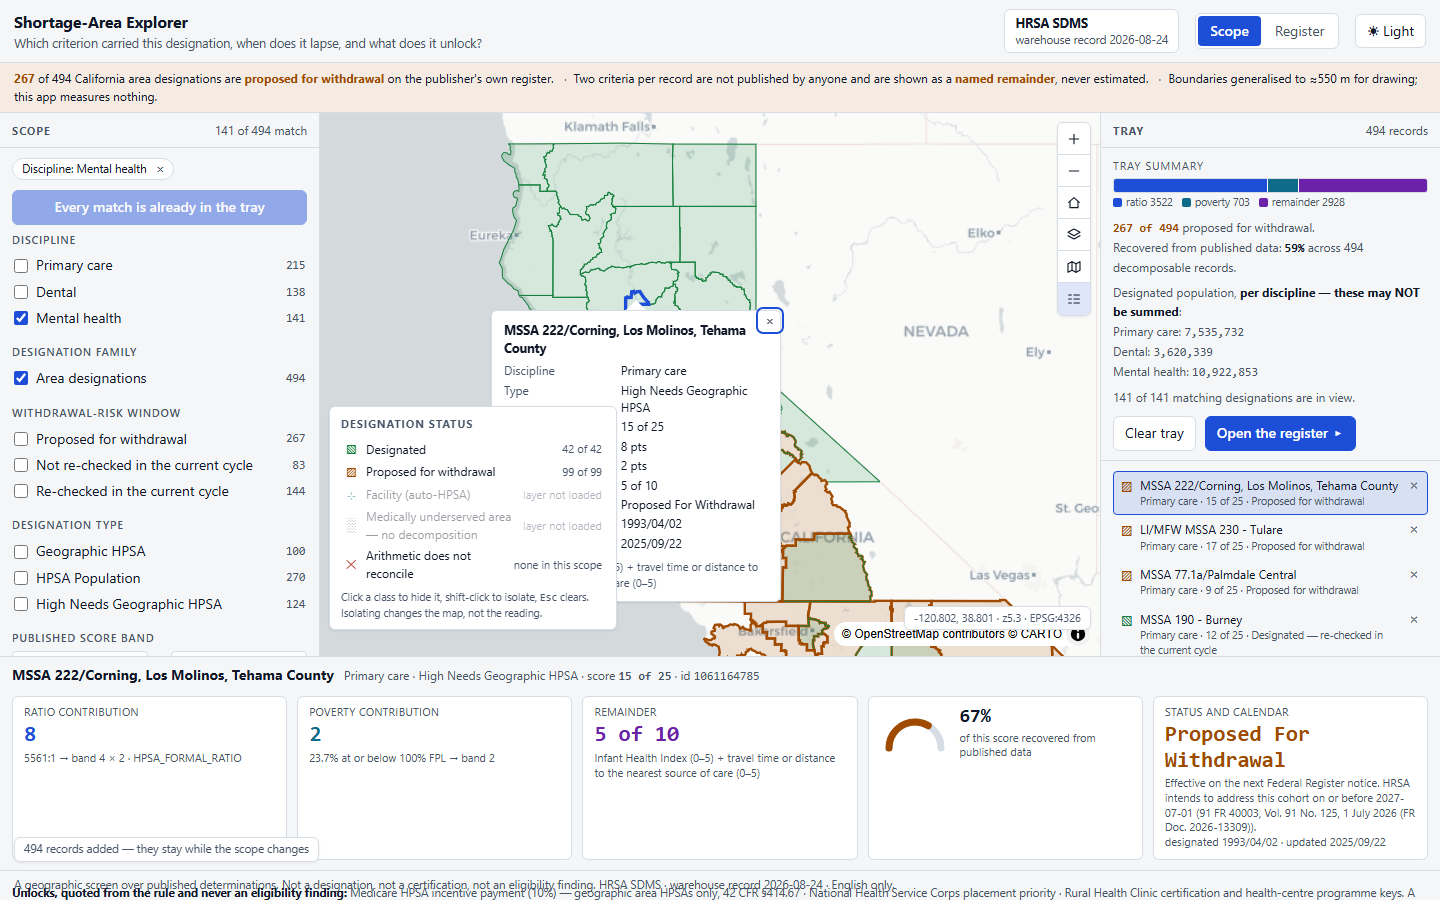
Not "this area scores 15", and not a modelled estimate of the missing points, but the two contributions the published rule and the published data can actually produce — and an explicitly labelled band for everything else.
The remainder is never split, never distributed and never estimated. It carries a colour of its own — not a tint of the primary, because a tint reads as less of the same thing, and the remainder is a different thing: the part of a published score that no public dataset can recover.
And a record whose arithmetic disagrees with the published total is flagged, never dropped. Dropping it would turn a candour feature into a lie. The flag exists, is asserted in a suite, and today's data never fires it.
That is the whole device: you assemble a document while the view changes underneath it. A tray that resets on a scope change is the fallback, not the product — so the accumulation is asserted explicitly rather than assumed.
Primary care 0–7 against a ceiling of 10, dental 0–6 against 6, mental health 2–12 against 13. That is the strongest available evidence that the reconstruction is the publisher's own arithmetic, and not a coincidence that happens to add up.
A quarterly republication should turn it red. The constants are then known stale rather than quietly wrong — the only honest posture for an app whose subject is a register that moves.
Among them: a legend class reading a false 0 of 0 where the truth was "layer off"; the tray summary buried under 494 rows; a stray dot painted by a rounded line cap on an empty gauge. Every arithmetic test stayed green through all three.
Reading the figures: every number above was measured against live public services on 2026-08-24, and every record in the application is a published federal determination. There is no generated lane in this app at all — which is stated on screen rather than left to be inferred.
Every one of these is written into the delivered application's own README. A tool that hides its edges costs you the project it cannot finish.
Your state's rows from the same federal register, your office's list of designations under review, and an owner for the scope. Two weeks, and this register reads your book instead of California's — the rule does not change at the state line.
And the shape generalises well past health: a published total, published inputs, and a published band table → per-record contributions and a named remainder. Every regulated sector has one, and the honest version is always the same — compute what you can, name what you cannot, and flag rather than drop a disagreement.