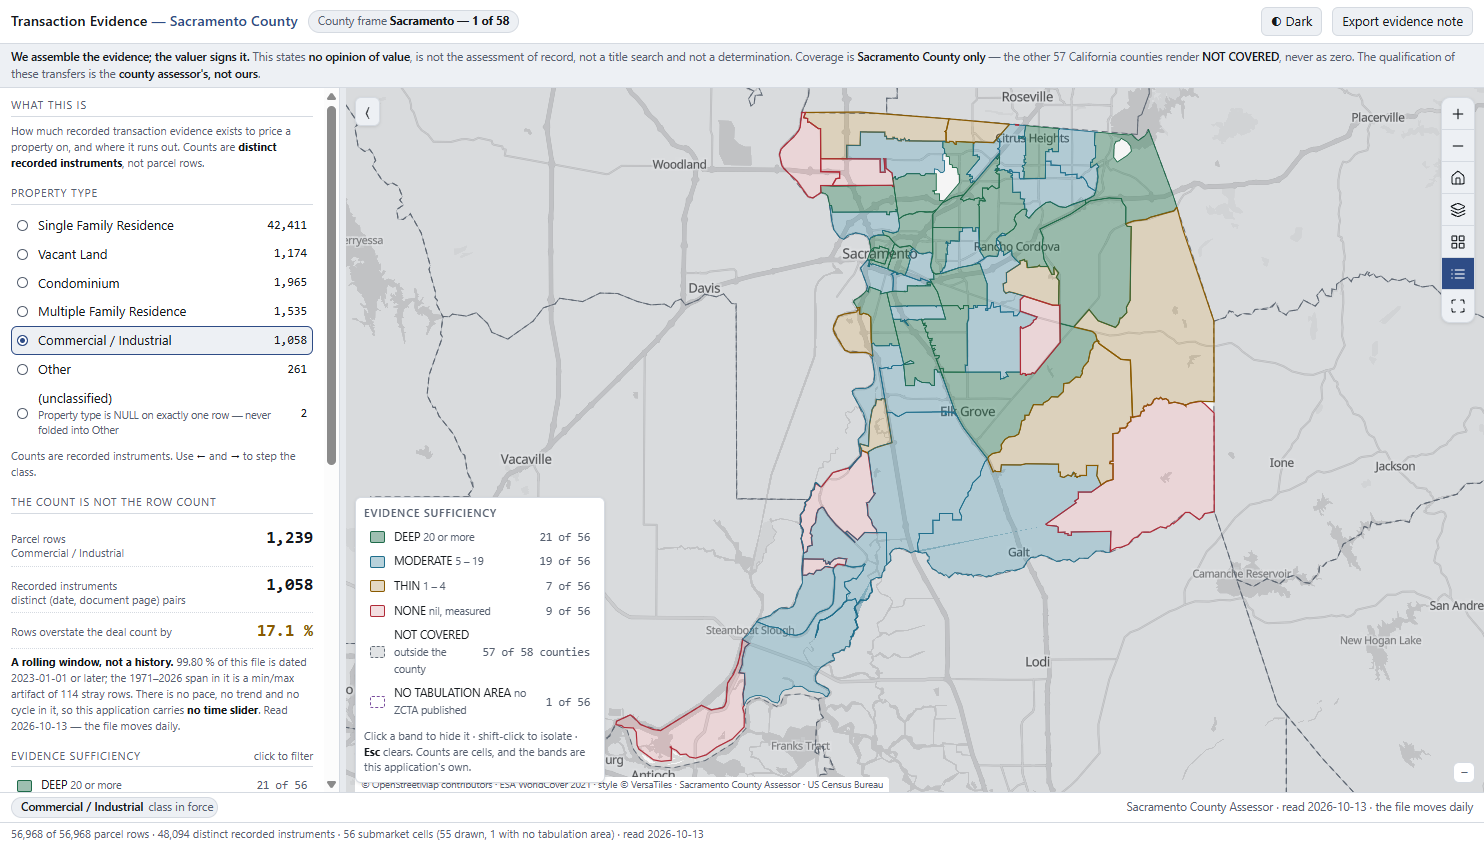
This app does not tell you what a property is worth. It shows how many recorded sales exist nearby to support a valuation, and where there are too few. It uses the sales file the county publishes, and it marks areas with no sales clearly.
Say a submarket (the local area you compare against) had four commercial sales in three years, not forty. A buyer who knows that can price in the risk or walk away. The valuer can see up front whether there is enough evidence for a confident figure, or whether the report needs a material uncertainty note (a statement that the value is less certain than usual).
Both are questions about how much evidence there is, not about the value itself. The app answers the first and leaves the value to the valuer.
Free price indices leave condominiums out, so they can't show this. Paid comparable-sales services give you a list of sales, but they don't tell you when the list is too short.
The RICS standard on comparable evidence splits it in two. Category A is direct comparables: actual sales of similar property. Category B is general market data, such as indices and published averages, which gives guidance but not a direct indication of value.
| Source | What it publishes | Why it falls short here |
|---|---|---|
| FHFA House Price Index | Yearly price-change indices by county, ZIP code and tract | Shows how prices moved, not actual prices. Covers conforming mortgages only. Condos, co-ops, multi-unit and PUDs are excluded |
| Redfin Data Center | Monthly median price, price per sq ft and days on market, by ZIP and neighbourhood | Listed homes only (from MLS). No commercial, no vacant land, no off-market sales |
| Zillow research data | Modelled home values | A model estimate for homes. General market data (Category B) |
| ATTOM · Reonomy · CoStar | Deeds, mortgages and commercial sales, nationwide | Actual sales (Category A), but paid. They give you the comps list, not whether it is long enough |
| County assessor and recorder websites | Look up one parcel at a time; recorder searches often charge a fee | No way to see a whole area at once |
| Sacramento County "Sales by Property Type" | 57,524 parcel records, each with a sale price, date, property type and location. Free and public | Actual sales, free, and rarely used |
The RICS professional standard Comparable evidence in real estate valuation (2019, reissued 2023) lists what good comparable evidence looks like. Three of these can be measured from county records. The other four need the valuer's judgement.
| Quality | Checked here? | How |
|---|---|---|
| Enough of it: several sales, not one | YES | The number of sales in each submarket for the chosen property type |
| Recent: reflects the market on the valuation date | YES | The date of the latest sale in the submarket, and how many days ago it was |
| Similar to the property being valued | YES | Property type, sub-type and area, as the county records them |
| An arm's-length sale | NO | The county's deed codes can't tell a sale from a gift |
| Verifiable | NO | The standard says comparable data should not be taken at face value. Checking it is the valuer's job |
| In line with local market practice | NO | Can't be judged from a deed record |
| Driven by real demand | NO | Can't be judged from a deed record |
When evidence is thin, the RICS Red Book expects the valuer to say so, and calls this "not an admission of weakness". The standard also asks that evidence be recorded clearly and kept on file. The app's export is made for that file.
9,427 sales, 16.4% of the county file, are condominium, multi-family, commercial/industrial, vacant land or "other". The free price index leaves these out, and home-listing (MLS) data does not cover them. The 1,237 commercial and industrial sales are what paid services charge for.
Across four of these property types, 71 of 220 submarket and property-type combinations have fewer than five sales. That is about a third of the map.
These levels are the app's own, not a professional rule. The standard asks for "several" comparables without saying how many. The exact count is always shown, so you can apply your own threshold.
Sacramento's sales file covers the whole county. So if a submarket shows no sales, that is a real answer: there were none. Outside the county we have no data at all. Showing both in the same grey would mislead.
A dashed outline means missing data. A solid colour means a count.
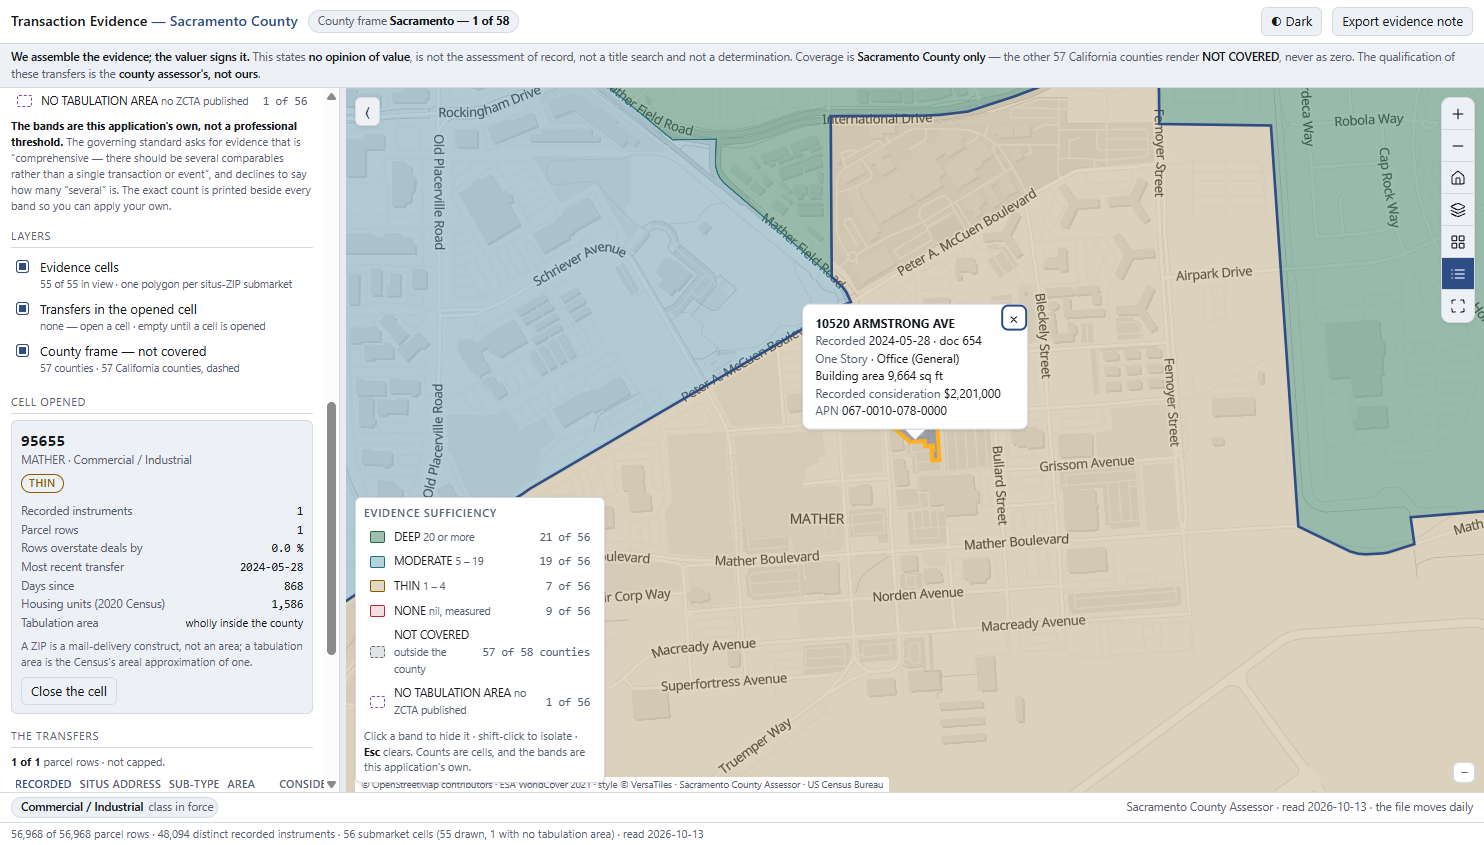
One deed can transfer many parcels, and the county file lists each parcel on its own line. If you count lines, the market looks busier than it is.
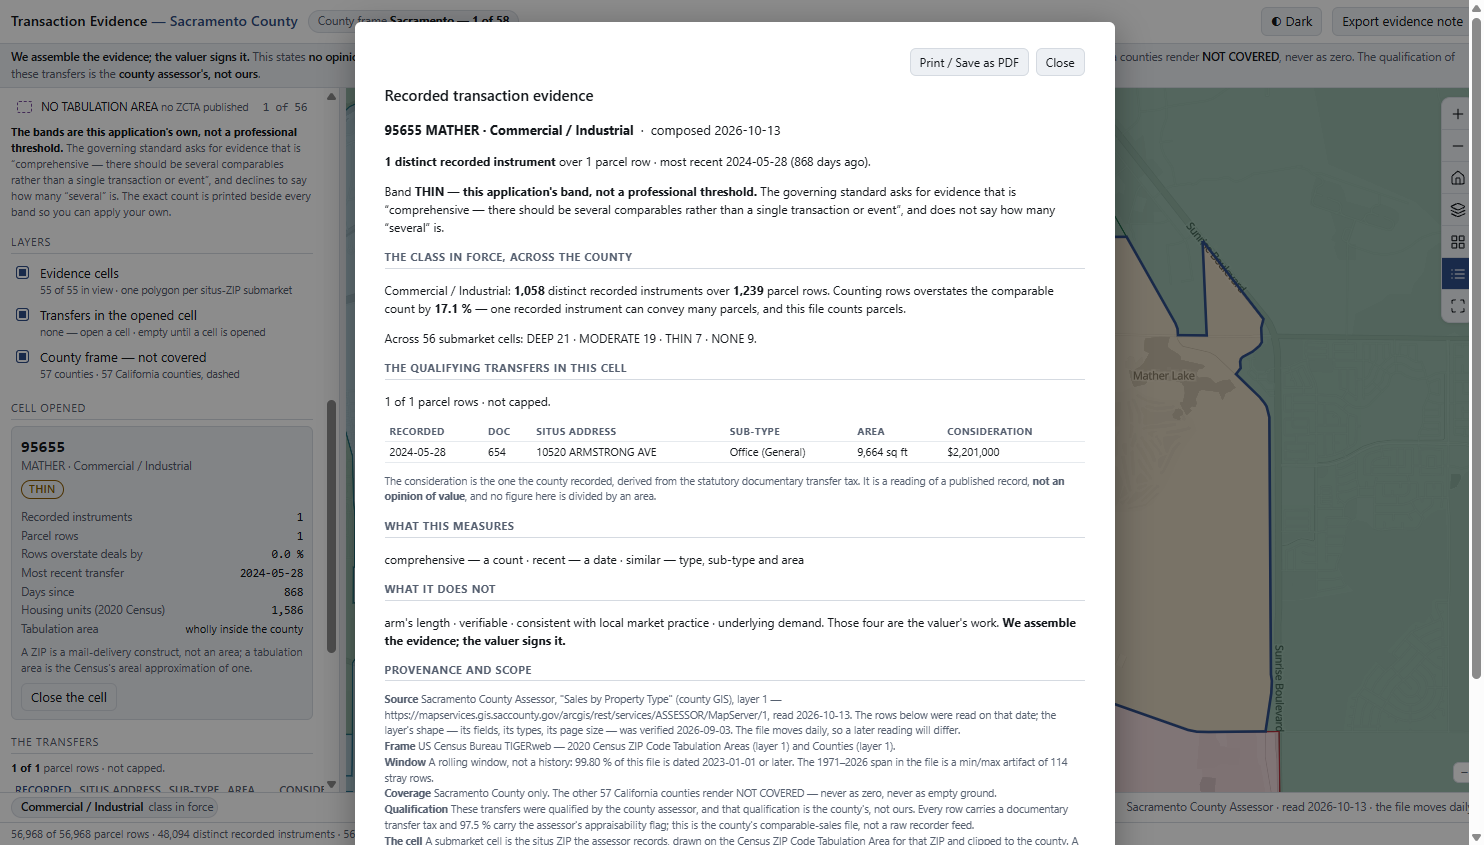
The app counts each sale once, even when it covers several parcels, and shows that count next to the record count.
The list and the map stay in step, so a single deed in a large submarket is easy to find.
All sales come from Sacramento County's published "Sales by Property Type" file. Nothing is modelled or estimated.
The county updates the file often. It gained 167 records in four days. So each figure shows the date it was read.
Every record carries a documentary transfer tax, and 97.5% carry the assessor's flag that the sale is usable for appraisal. A valuer should still verify them.
We need a file of recorded sales with a date, price, property type and parcel ID; the submarket boundaries you work with; and a note of the areas it doesn't cover. Setup takes about two weeks.
Fitted to your market: submarket boundaries, property types, the thresholds for each evidence level and the currency are all settings, not new code.