Concentration & Exposure Analyzer · Financial Services
Which regions use up most of our concentration limit?
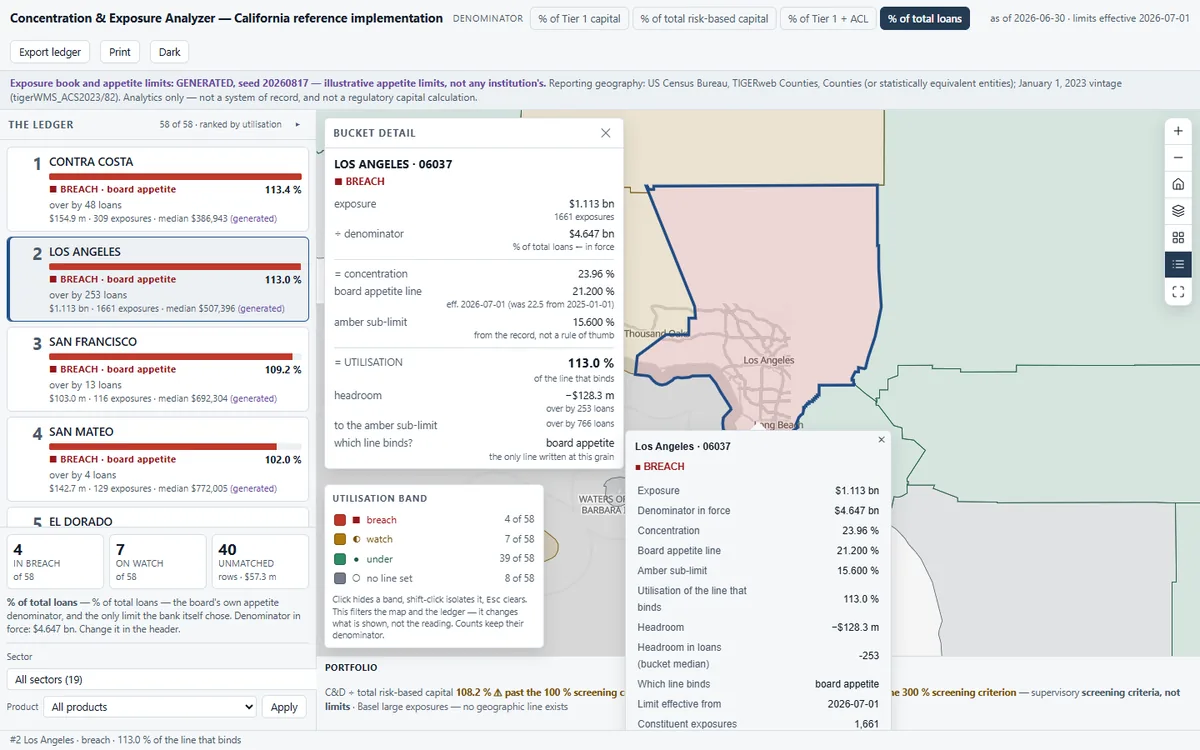
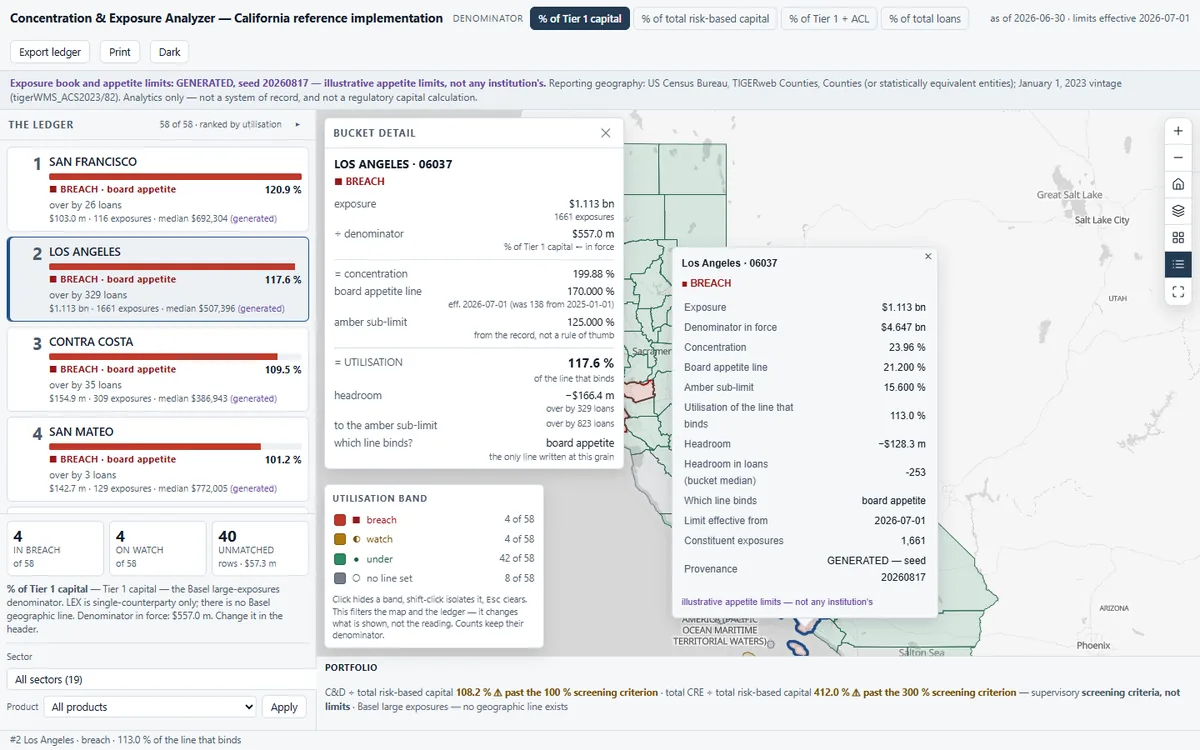
Ranks every county bucket in a loan book by how much of its own appetite limit it uses, pins breaches to the top, and says how many more loans fit before the line.
Before you open it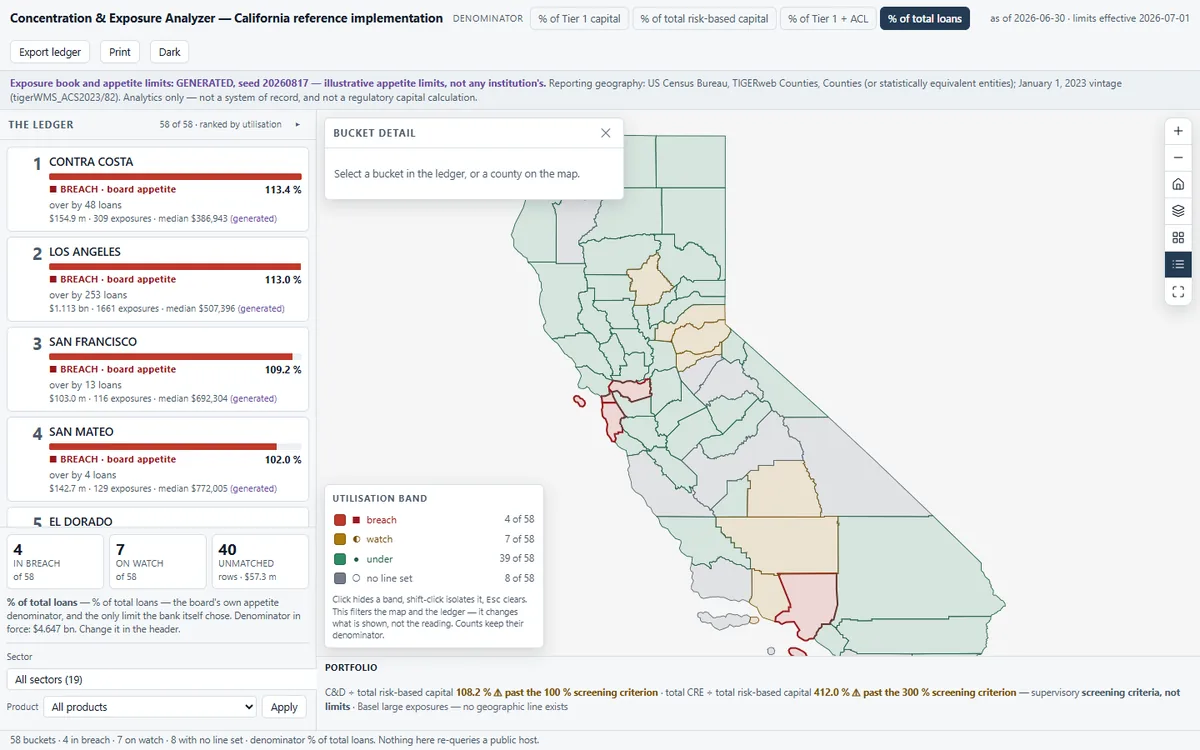 1
 2
 3
What you'll do in the app
1Read the ledgerBuckets ranked by how much of their limit they use, not by size, breaches first.
2Pick a bucketThe map flies to that county; click a county and the ledger finds its card.
3Change the denominatorSwitch to Tier 1 capital and every utilisation, rank and headroom changes.
Demo dataA generated California loan book and illustrative limits
StandardBasel geographic concentration
Runs onStrata, or your existing Esri services
Built fromAn open recipe, in one run with Claude
On your own data
Want this on your own data?
We deliver it for you
We set it up on your data and your rules, load your first layers, and support it on Strata Hosted or Custom.
Delivery, licence and annual supportKeep exploring
All 11 Financial Services apps →Explore similar apps
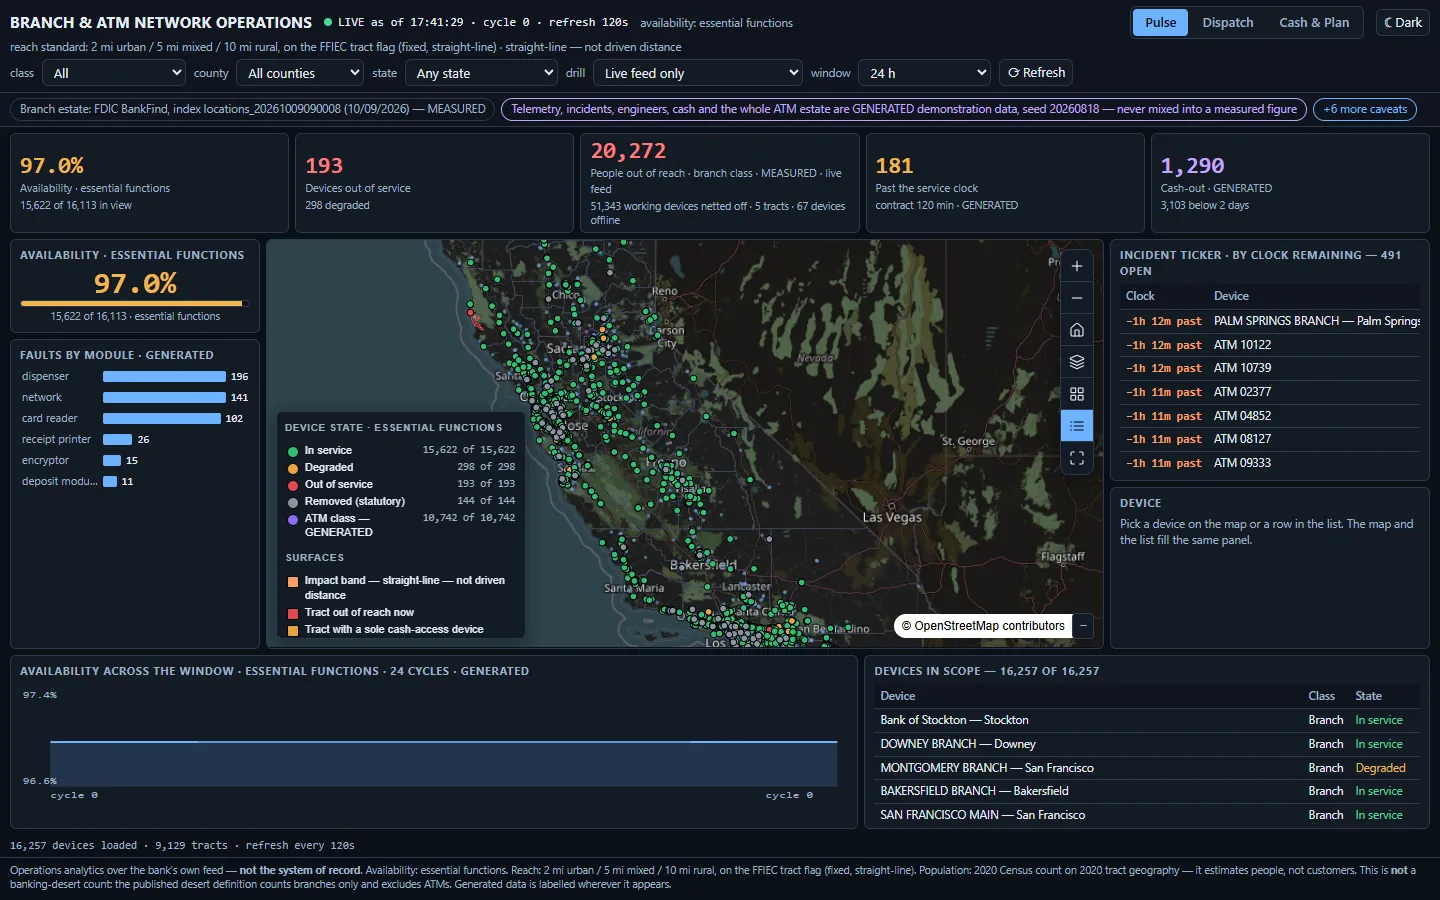
Branch & ATM Network DashboardWhich ATMs are down right now, and who is cut off from cash?See the app →
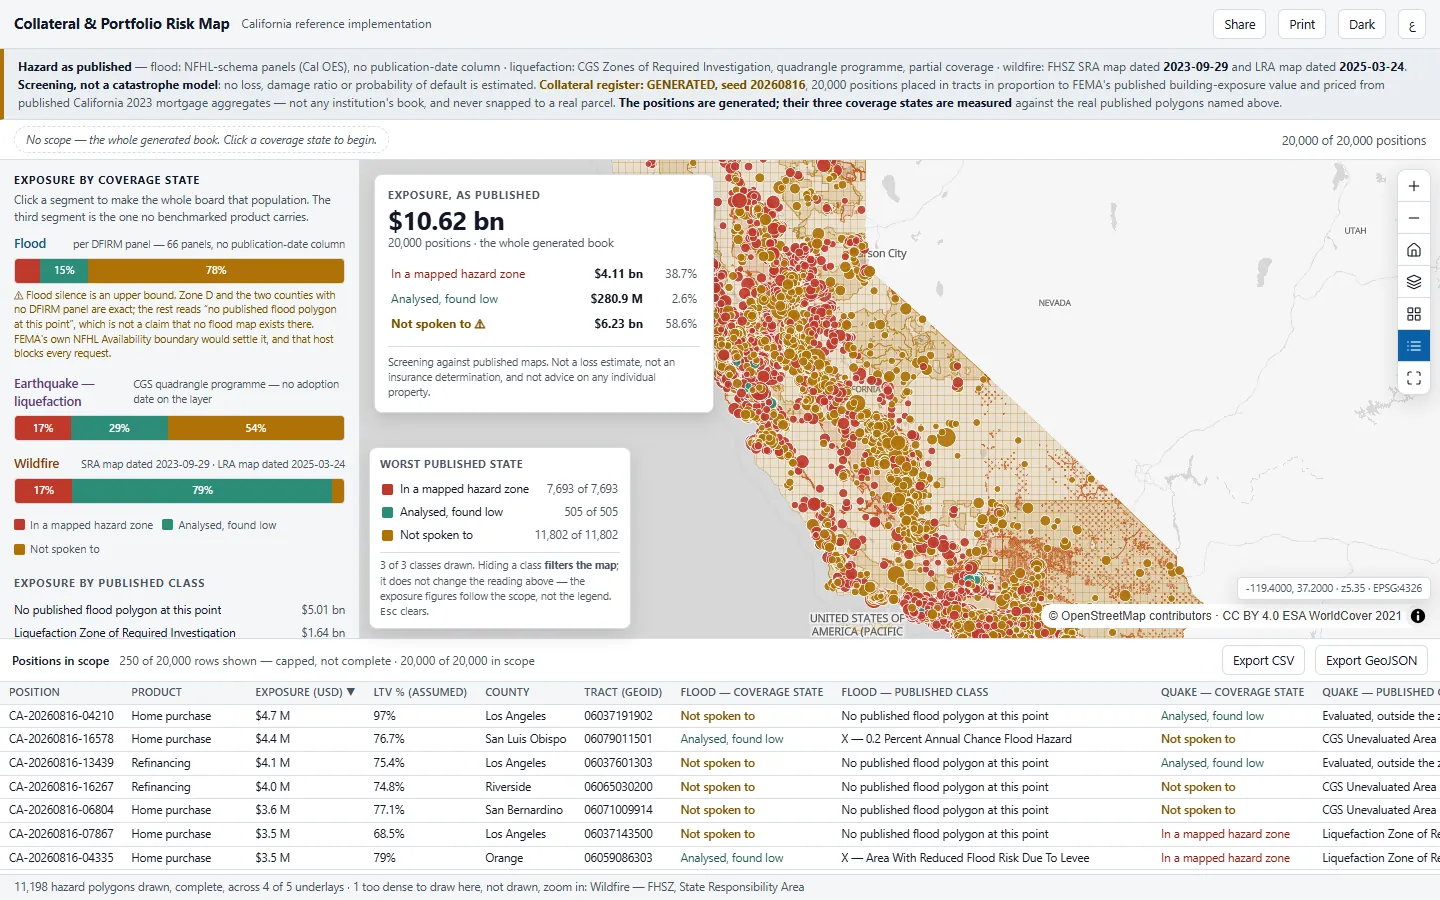
Collateral & Portfolio Risk MapHow much of our collateral sits where no hazard map has looked?See the app →
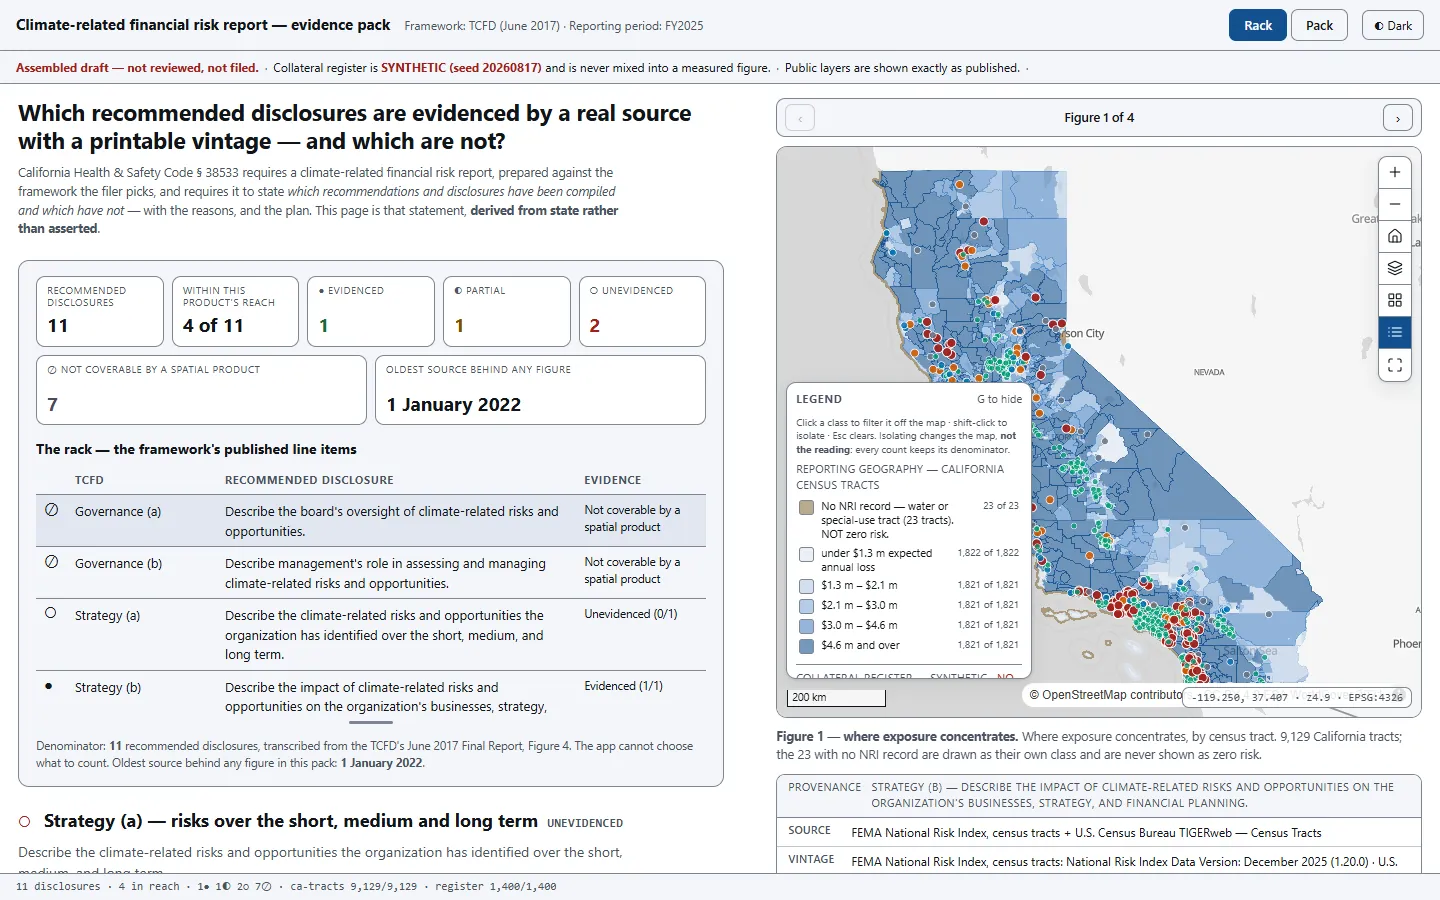
Climate-Risk Regulatory ReportingWhich disclosure lines can we actually prove?See the app →